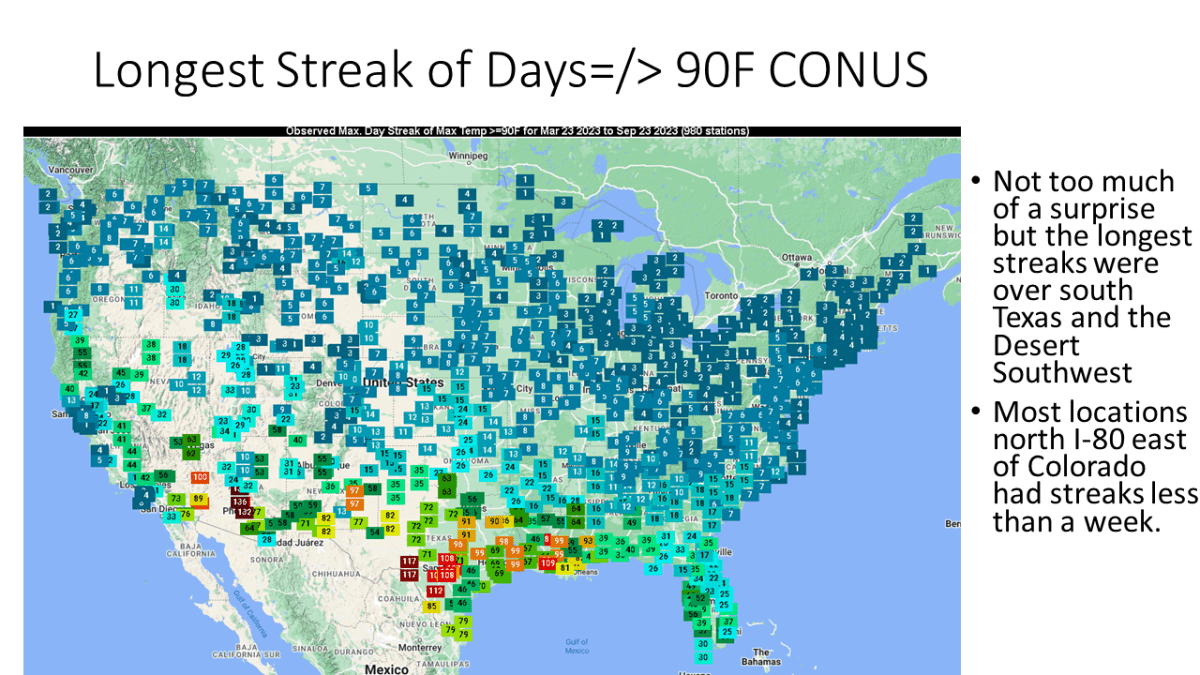
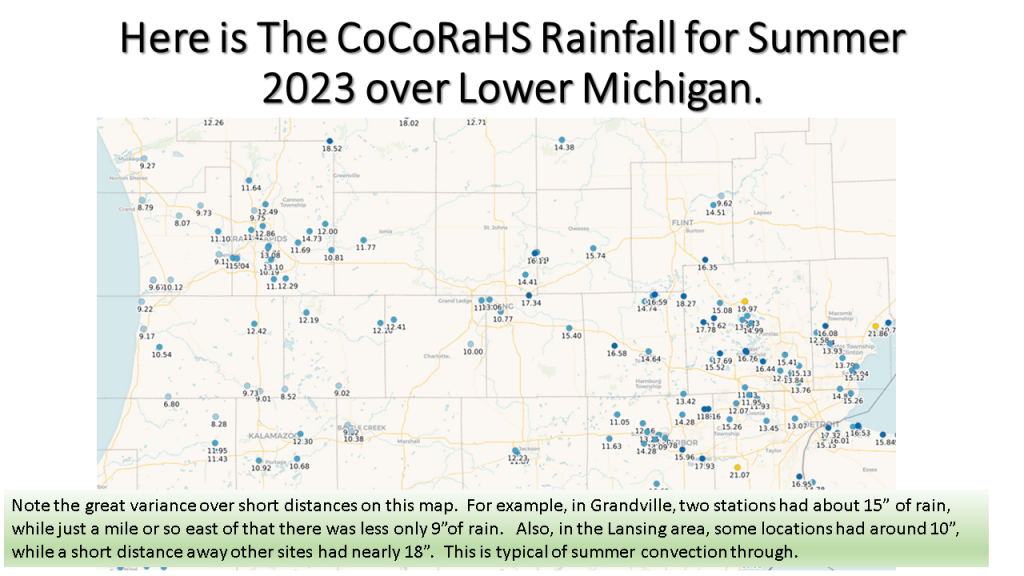
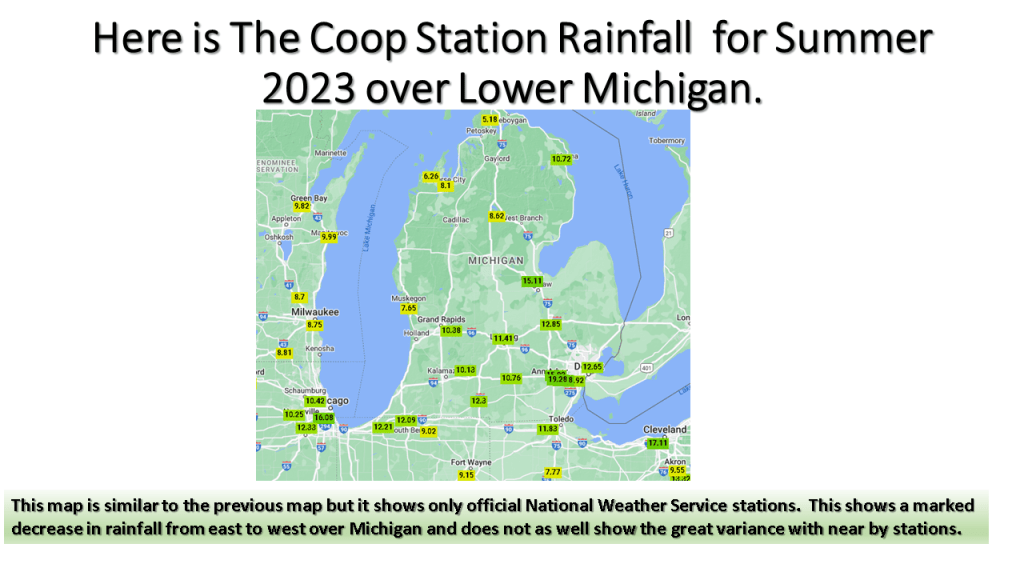
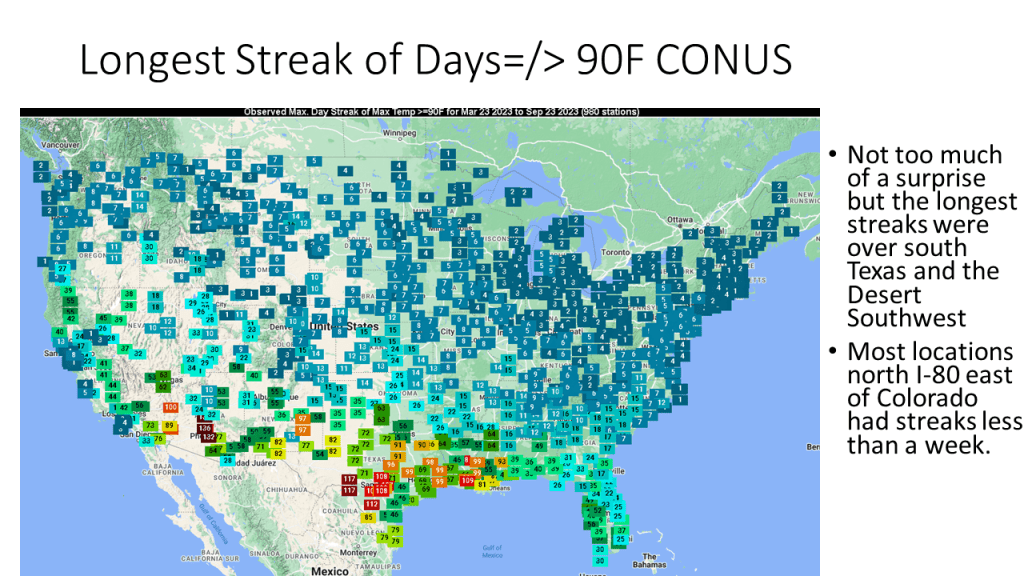
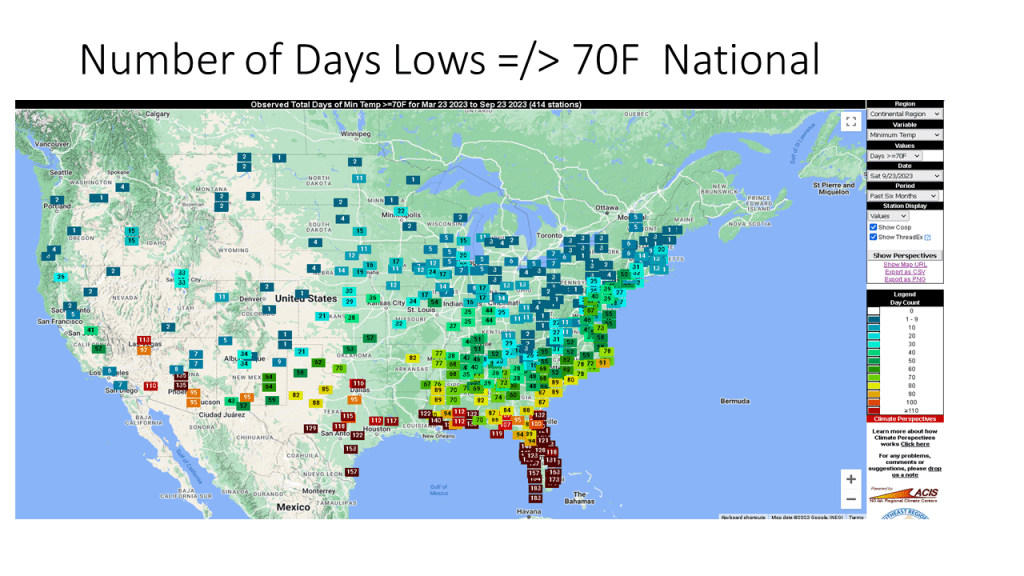
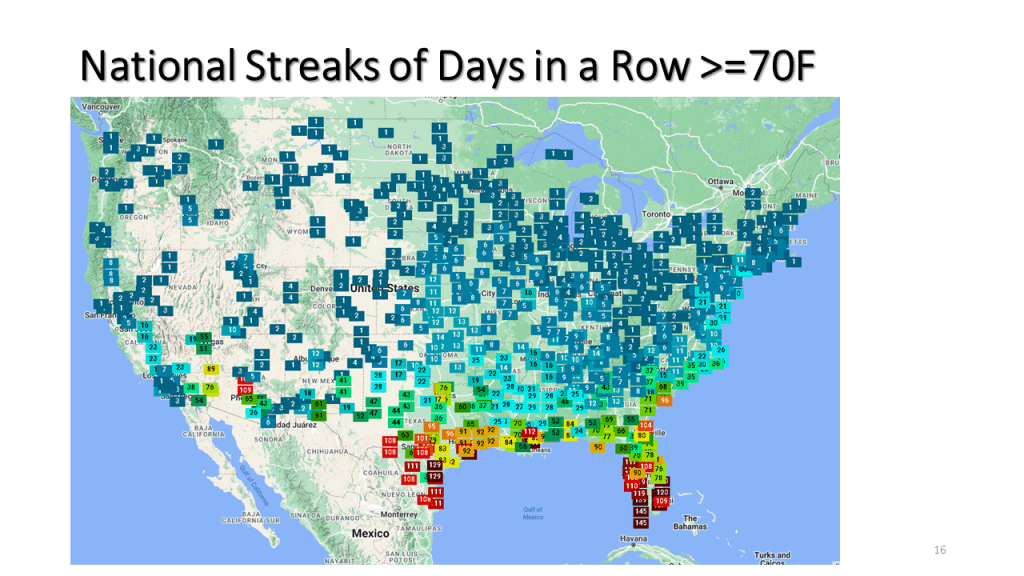
Here I have the frequency for highs in the 90s across the CONUS (Continental United States), the longest streak across the CONUS, the frequency of lows of 70 or more and I few more NCEI charts to show how hot of a summer this was both nationally and regionally. I also have a few precipitation maps so you can see that the great frequency for hot weather was were it rained less, relative to normal for that area.
I have added 2 slides to this presentation ( 8 and 9). These two slides show that what one uses for the “normal”, greatly impacts what the departure from normal looks like. I used 1991 to 2020, the official NWS normal period for the image on the top left, then 1895 to 2000 for the image on the top right, not the area of below normal is significantly less. That is because the period 1991 to 2020 was warmer than the 1895 to 2000 period. On the bottom left the mean is 1895 to 2020, that has no below normal areas. This seems questionable to me since the ranked normal’s on the next slide look a lot like the 1895 to 2000 on slide 8. I added this because I was getting some questions on this matter. I hope this helps.


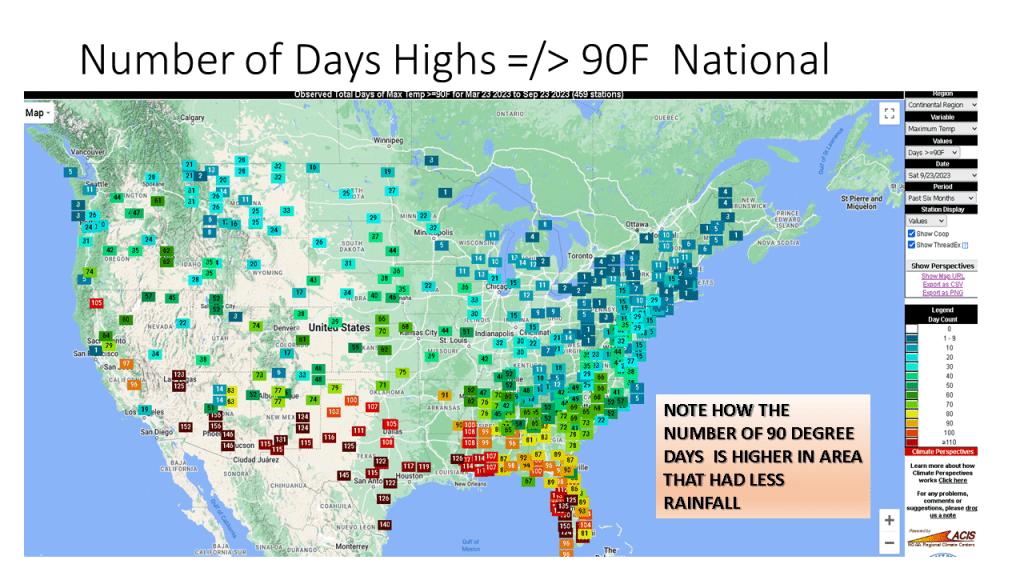


To put this summer in perspective, here is a chart compiled by Tony Heller from NOAA temp data showing the number of days above 90 since 1895. The percent of days above 90 this summer was well below average and the 25th lowest since 1895. Chart is attached at bottom.
Craig
>
LikeLike