Here is my summary of the 3 day snowstorm that impacted the entire Great Lakes between Sunday, November 26th and Tuesday November 28th.

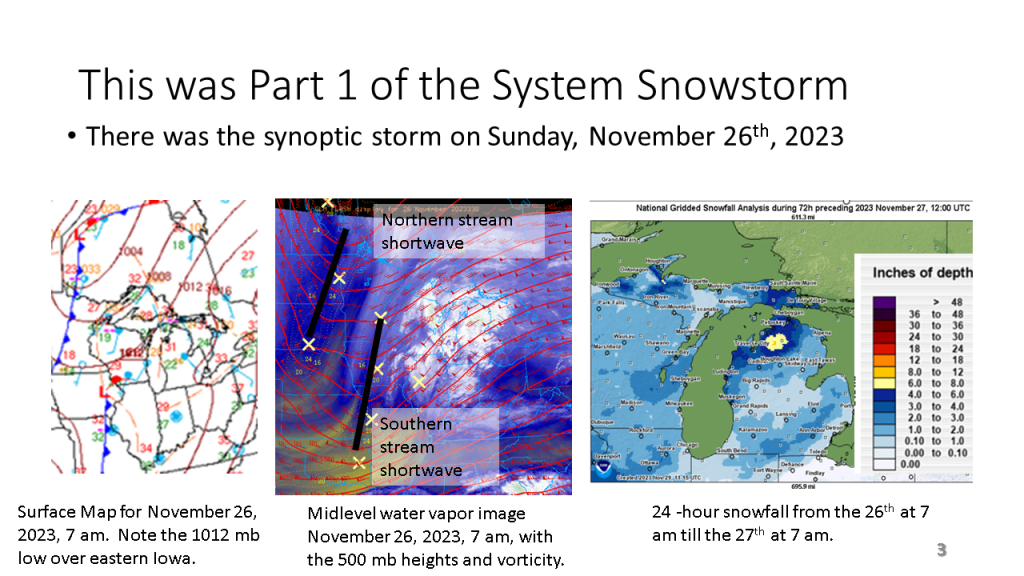
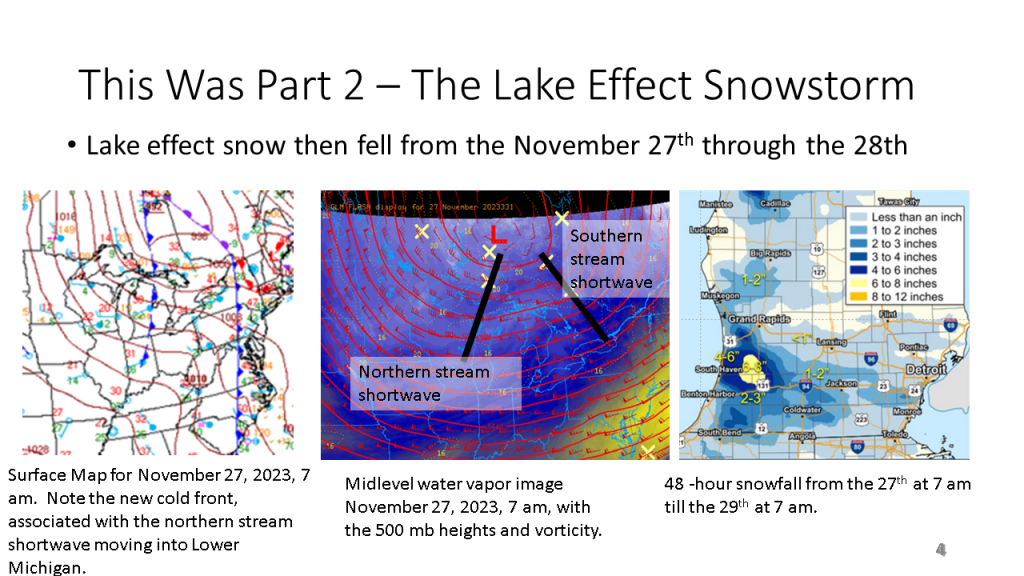
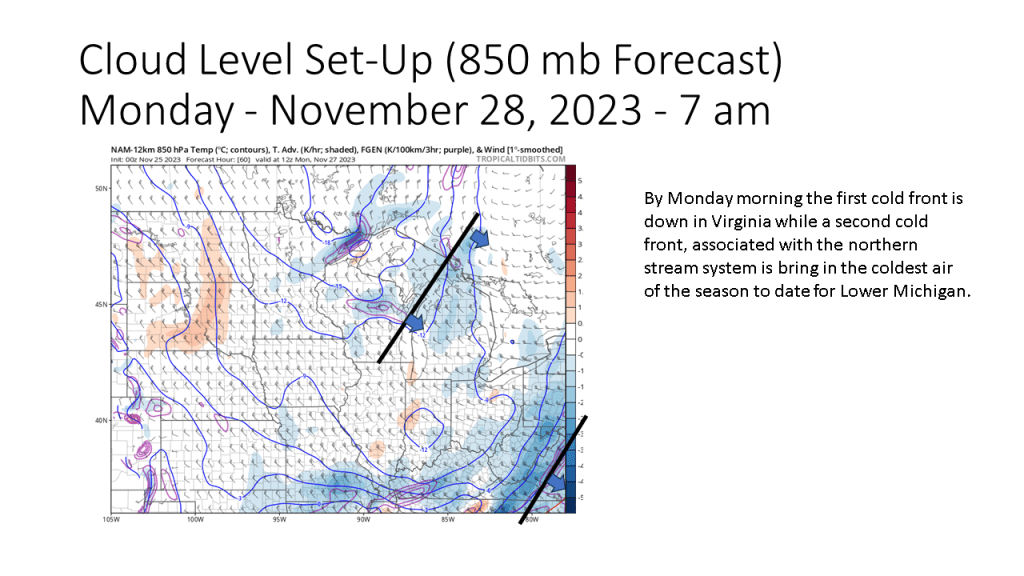
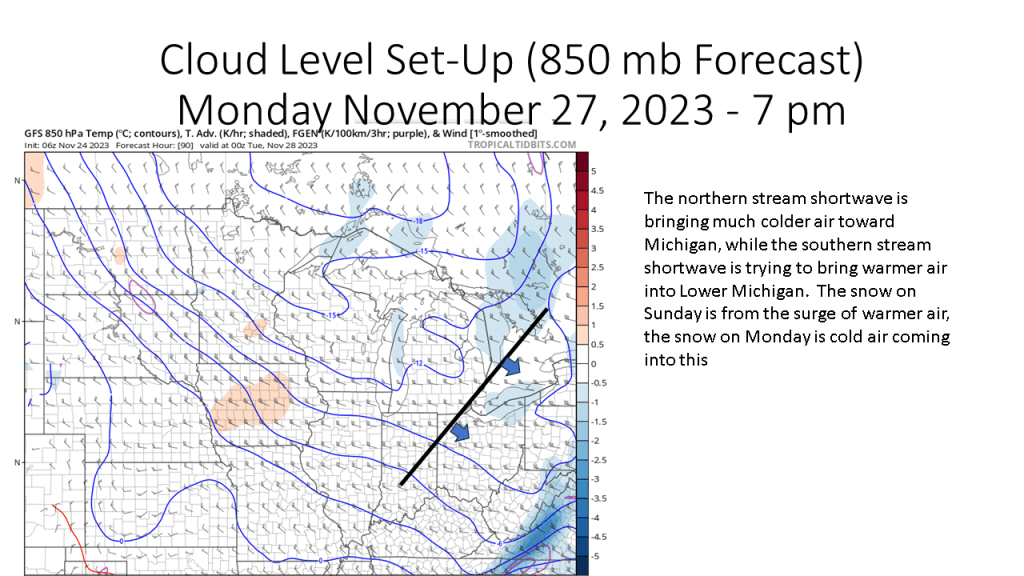
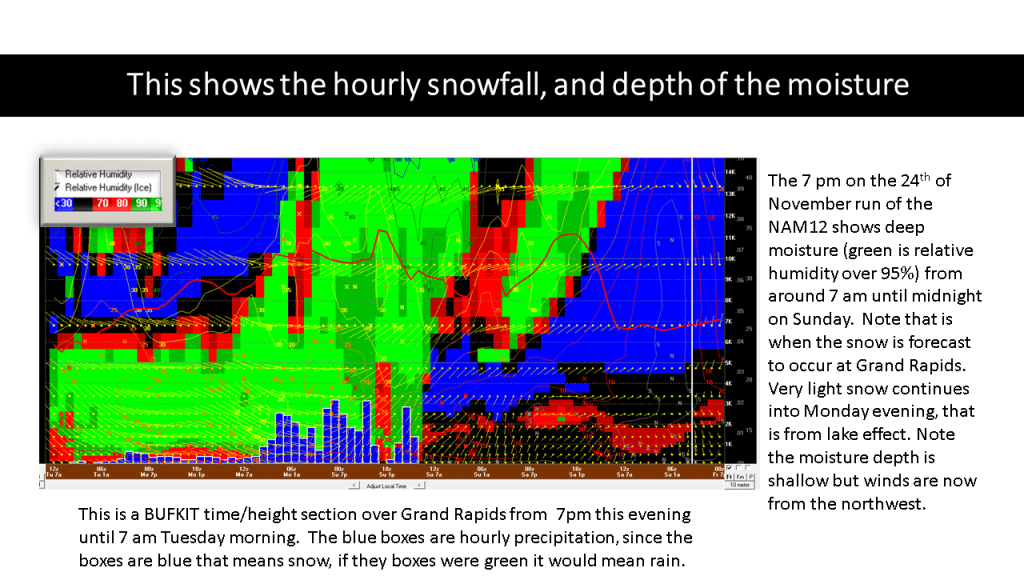
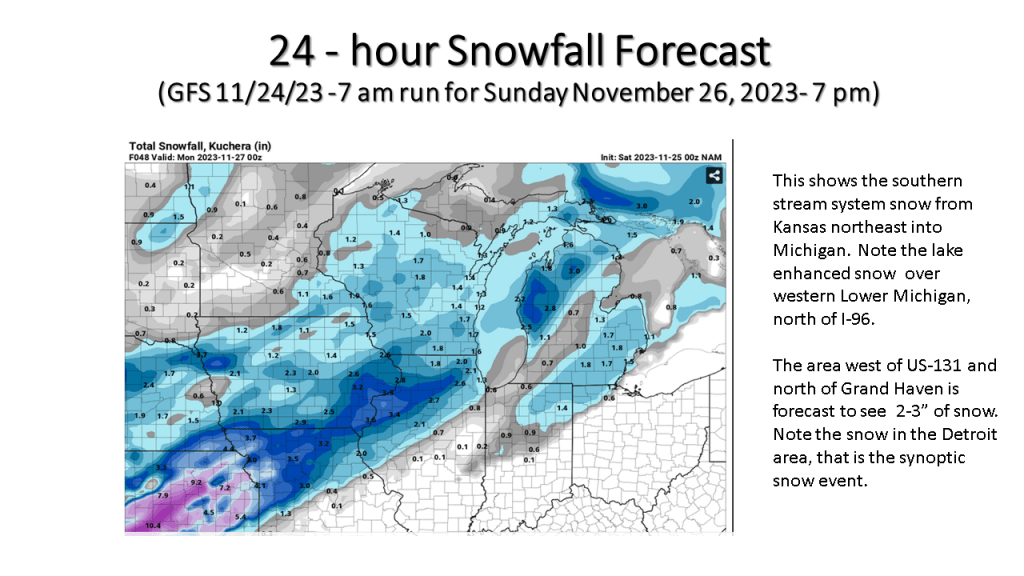
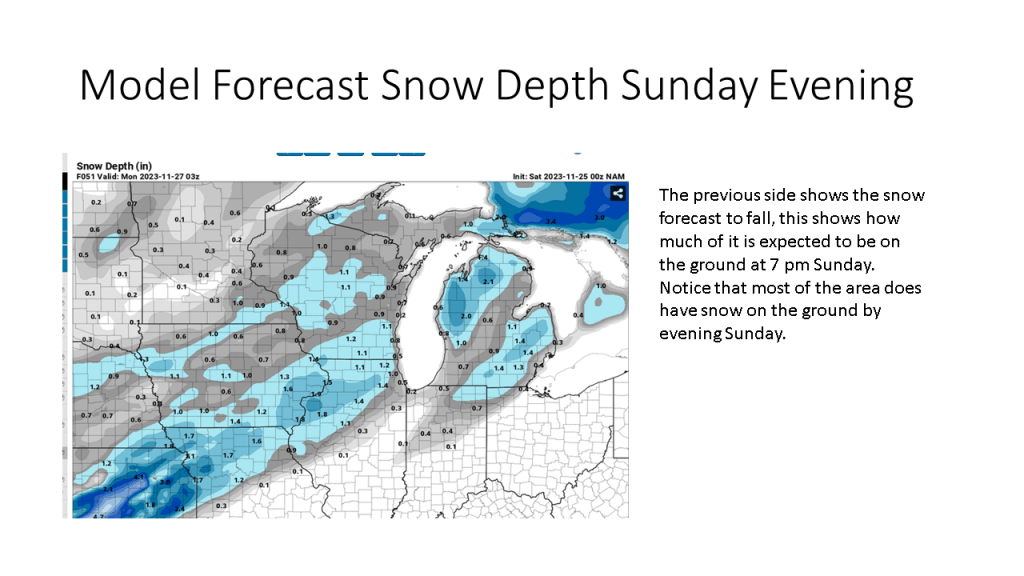
There was a southern stream shortwave that brought 1 to 3 inches of snow to the southern Great Lakes on Sunday. However most of the snow fell from lake effect as the coldest air of the season crossed the relatively warm water of the Great Lakes (mostly in the 40s) Monday into Tuesday. The heaviest snowfall was were the west to northwest wind was forced up-slope over northern Lower Michigan but even more so over the Tug Hill Plateau of western New York were over a 1 1/2 feet of snow fell.

Snow is on the way for the Western Great Lakes Sunday and lake effect snow is expected over Michigan and down stream of Lake Erie Monday into Tuesday. It will be much colder the first half of next week too.

Looks like a rainy night tonight and during the day tomorrow over the eastern CONUS. There is an enhanced risk of severe storms over Louisiana this evening.

This blog is really more about showing those who do not know about the SPC HREF model. I have some of the key charts from today’s HREF that show where the severe storms are expected, the strongest winds, and heaviest rainfall.

Here is a link to the SPC HREF model.

Here is my winter forecast for 2023-2024 for both the CONUS and for Southwest Michigan.

The short story is I am expecting a not so typical moderate to strong El Nino Winter this year. This is due to record warm sea surface temperatures in combination with an easterly wind over the tropical oceans, near 200 mb. This these two features acting together create an unusual amount of blocking in our Northern Hemisphere jet stream. This will mean periods of extremely cold weather and periods of unusually warm weather for a good part of the central and eastern United States lower 48 states. Even so, for Southwest Michigan and actually for all of Michigan I expect snowfall to be below normal but we will get a decent amount of snow nonetheless.

Here is a more detailed both CONUS and for Michigan, October Climate Summary.

By waiting until the 8th, I can get the maps from NCEI (National Center for Environmental Information). I have added graphs from xmACIS for the daily temperature and precipitation plus I have the monthly climate summary from Grand Rapids and Gaylord.