Warmer than normal temperatures are expected over most of the CONUS following the system for the third week of July.




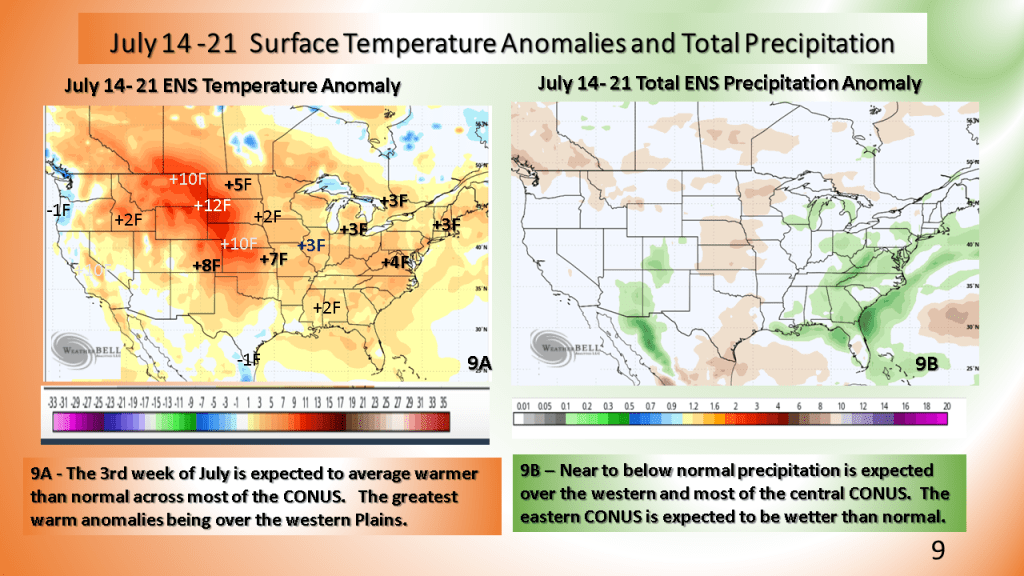
Warmer than normal temperatures are expected over most of the CONUS following the system for the third week of July.
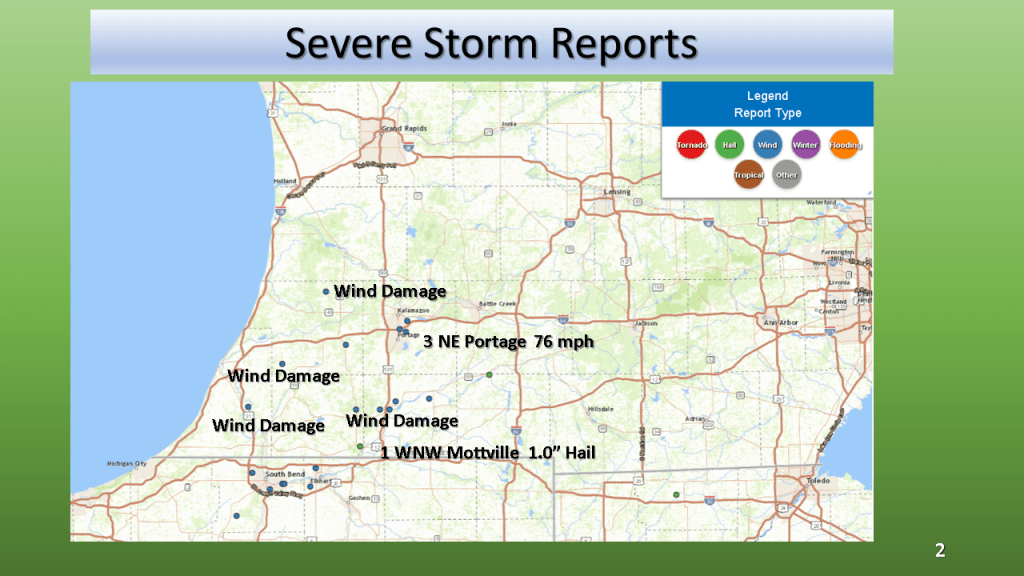
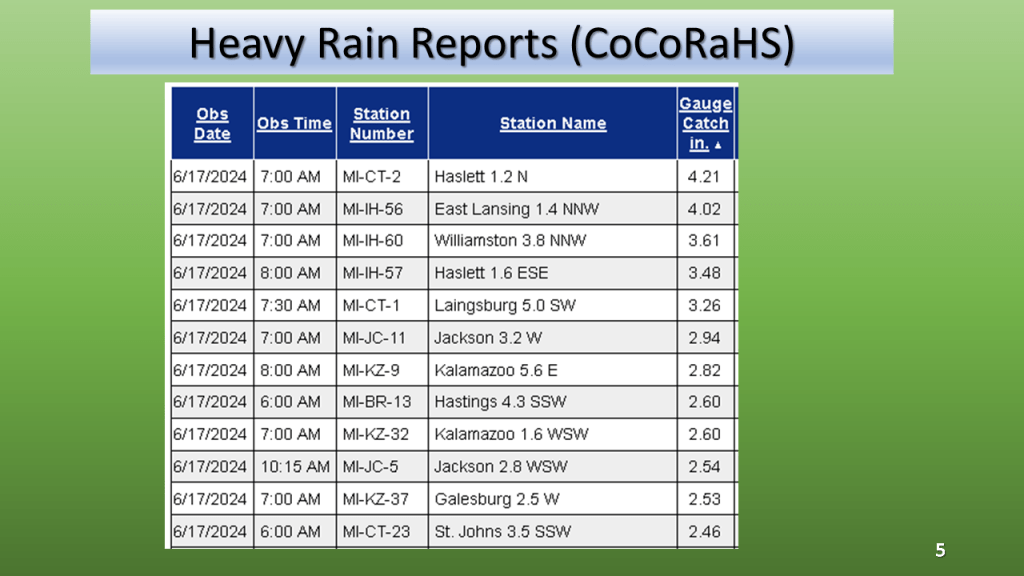
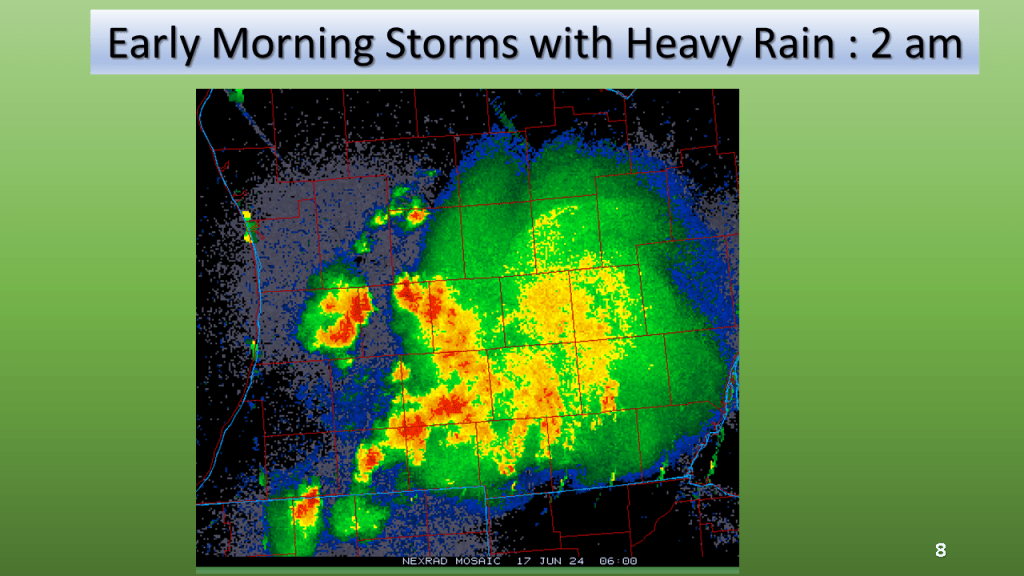
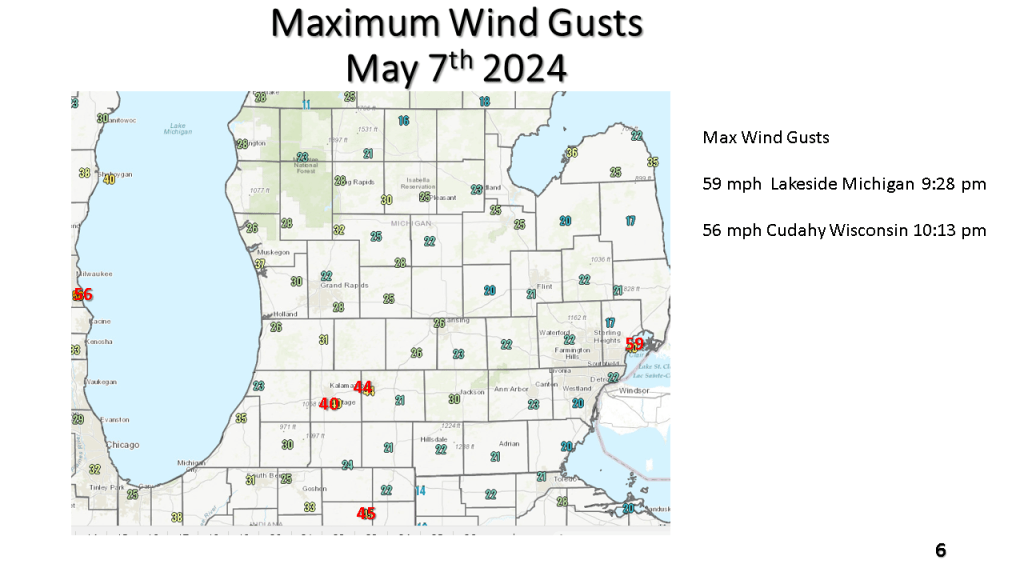
Winds to 76 mph, 1″ hail and rainfall to near 5″ within 12 hours





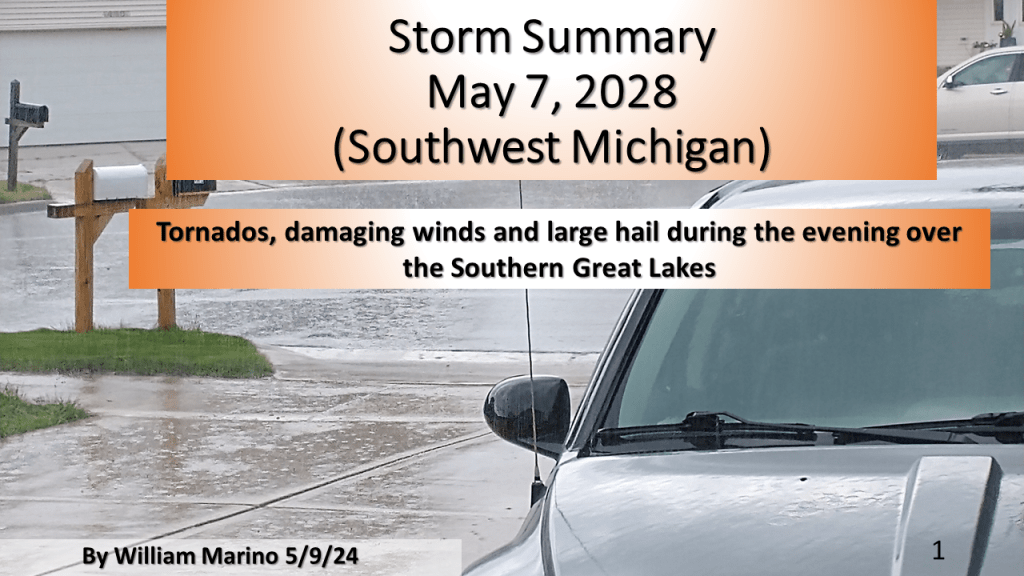
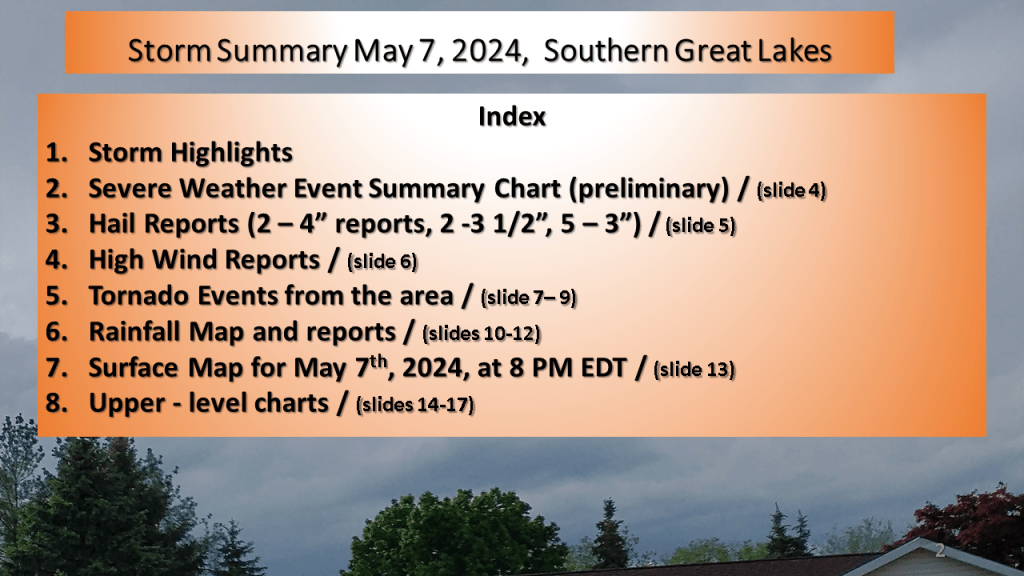
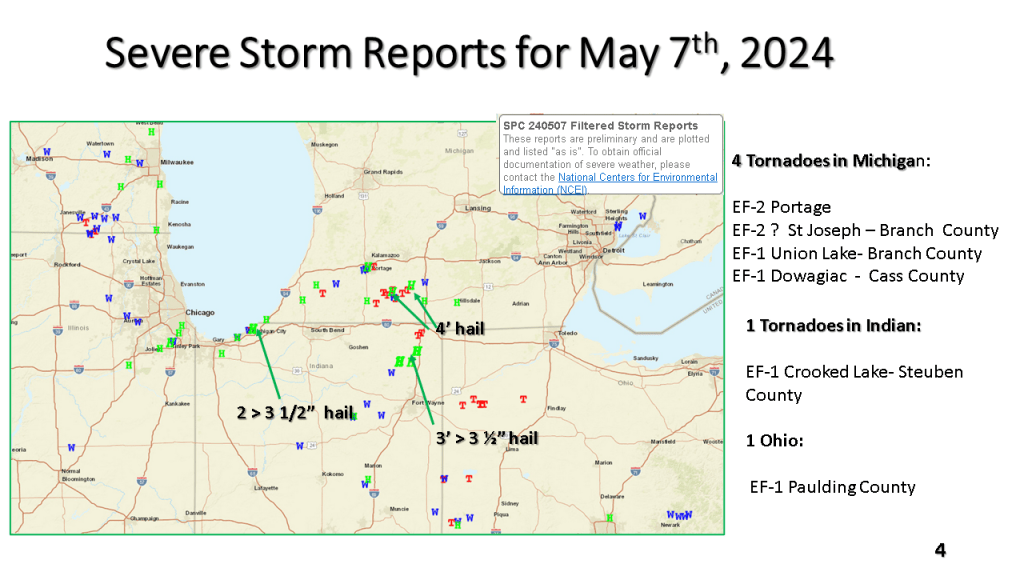
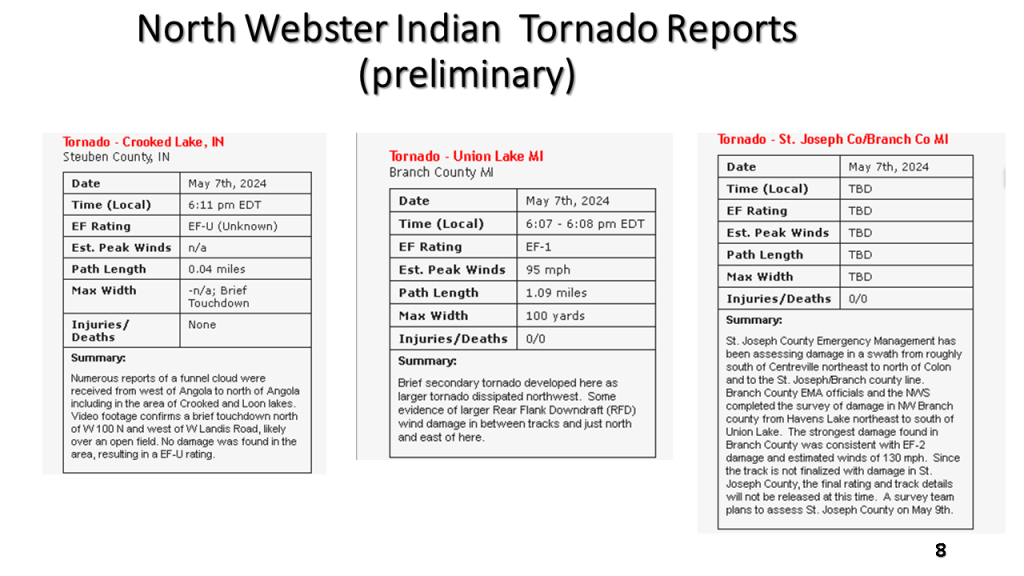
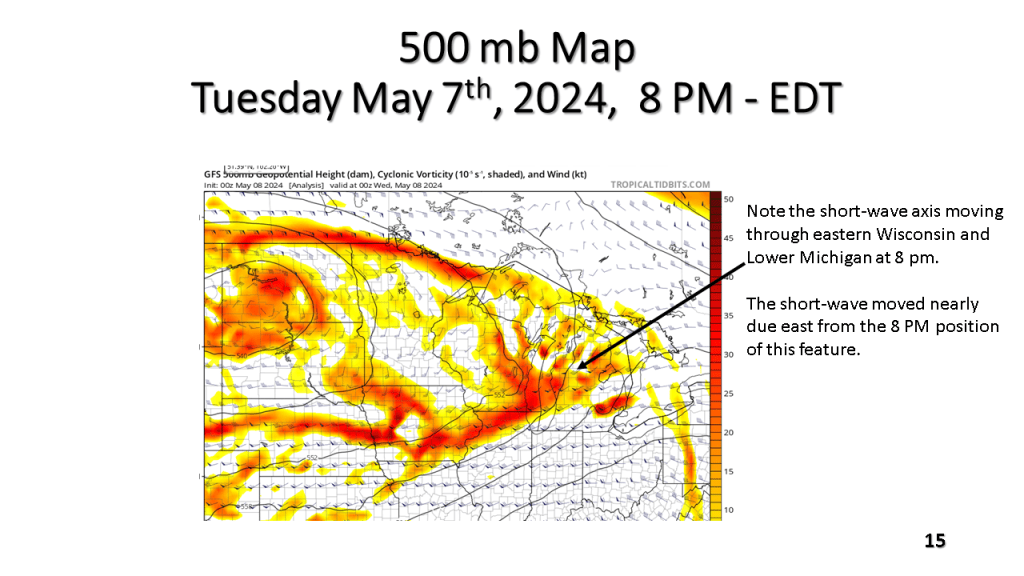
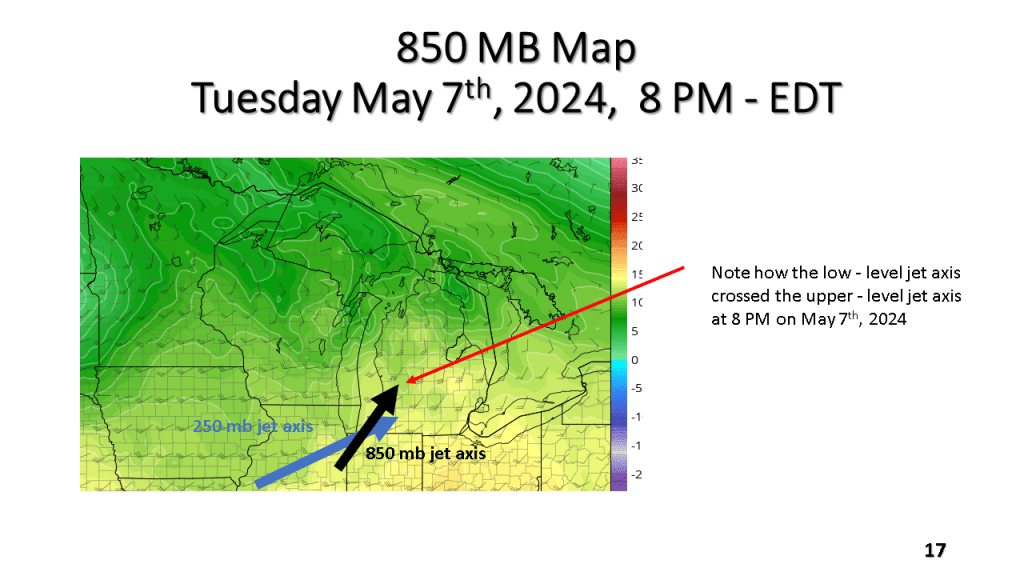
The Southern Great Lakes several tornadoes (2 EF-2), more than a dozen reports of hail larger than 2″, damaging winds, and locally heavy rainfall during the evening of Tuesday May 7th, 2024.






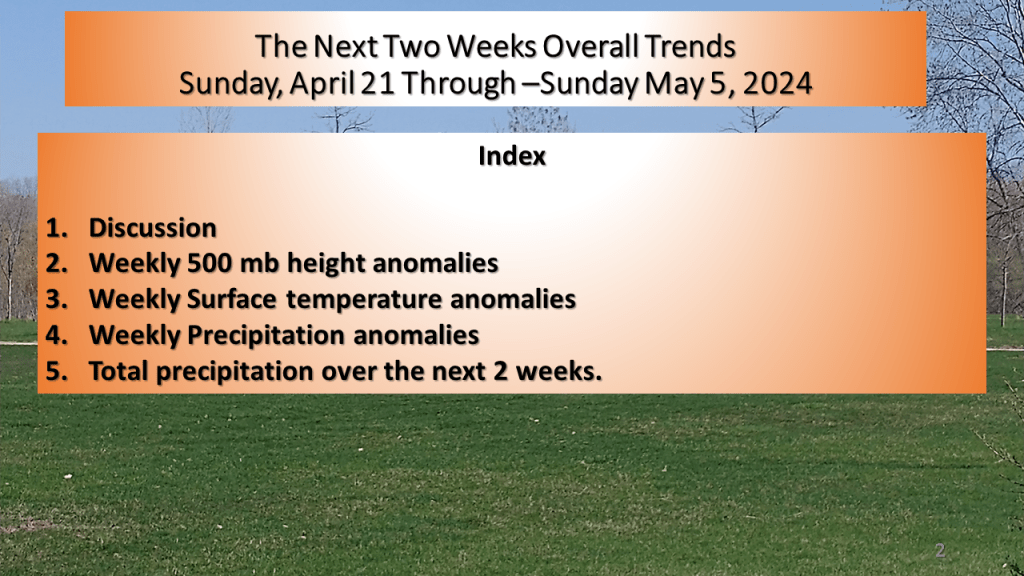
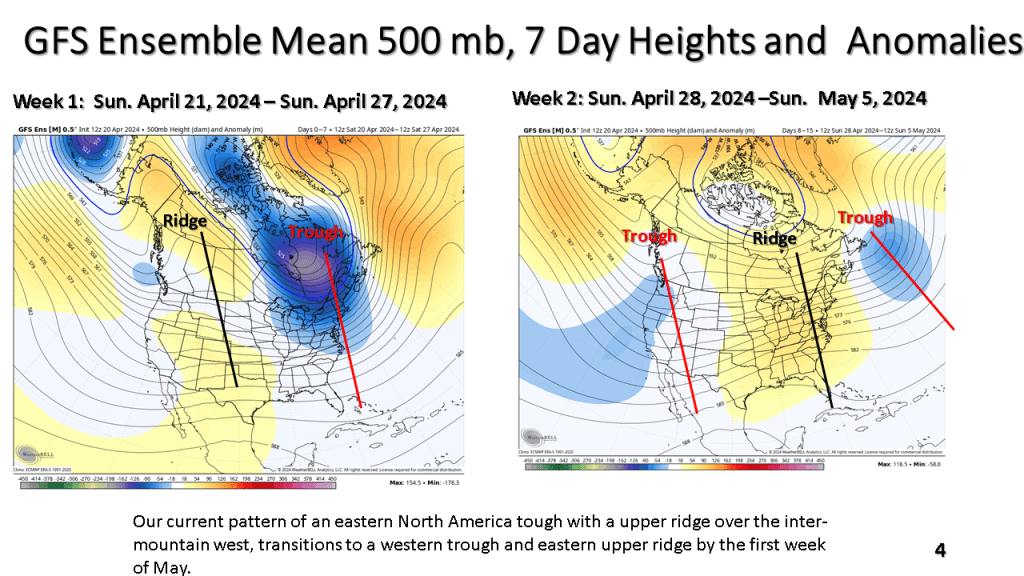
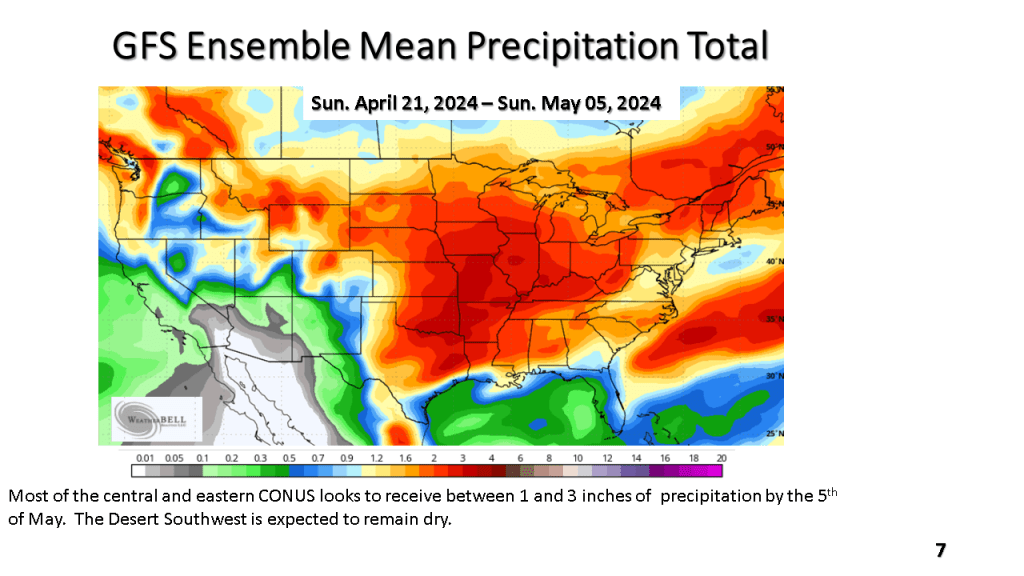
The current cool weather pattern has recently developed over the central and norther Plains. That cold air is expected to spread east over the next week. Frost and freezing temperatures are possible in northern and central sections over the next 7 days. Than, a warmer and wetter weather pattern is expected over most of the eastern and central CONUS.




(Severe reports were mostly large hail near Lansing)


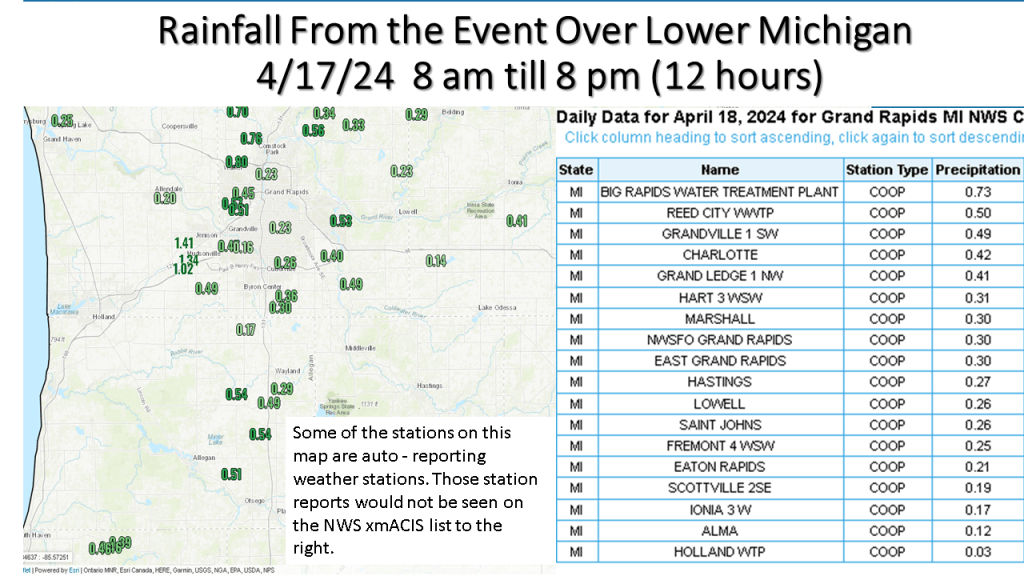


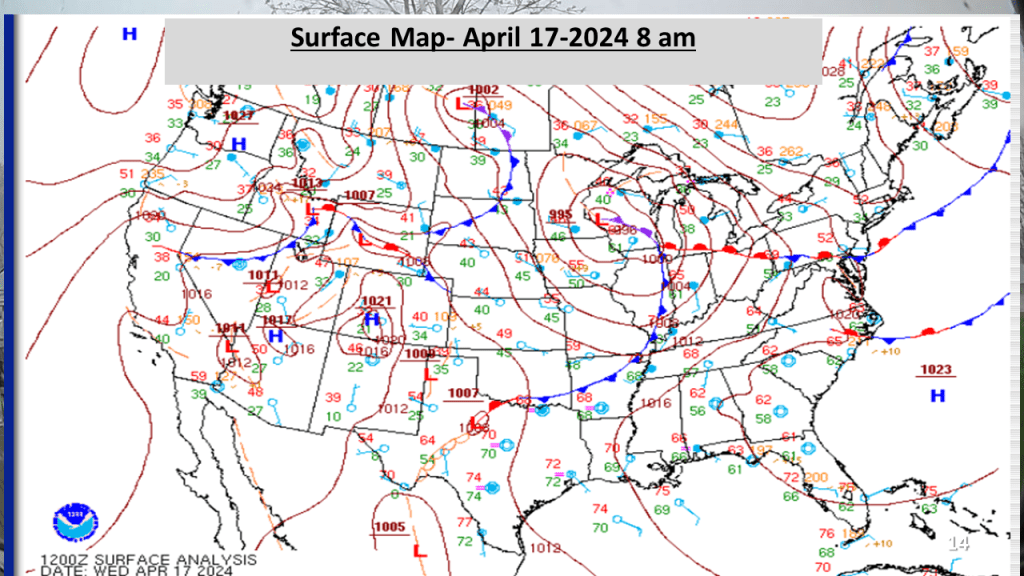
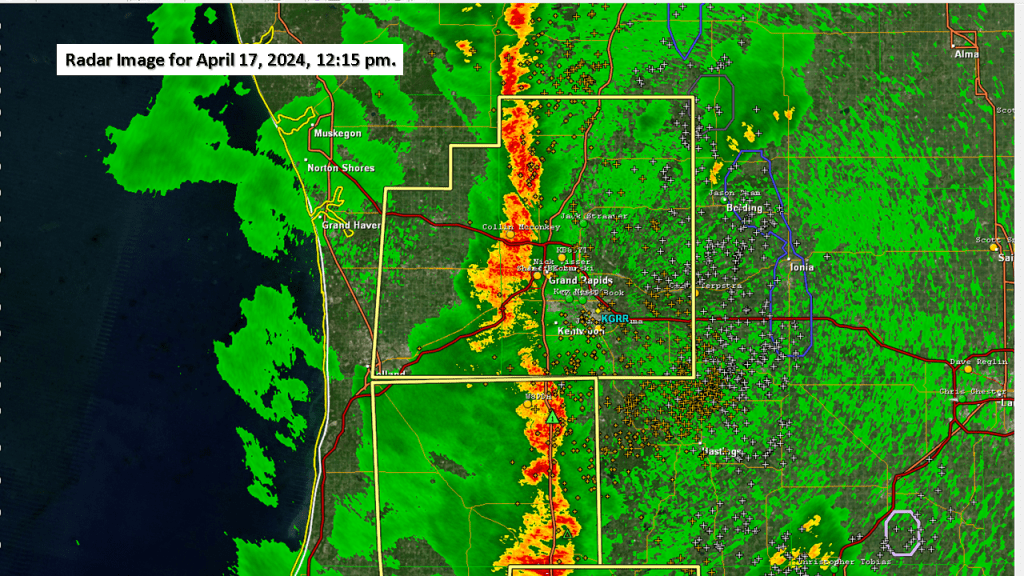
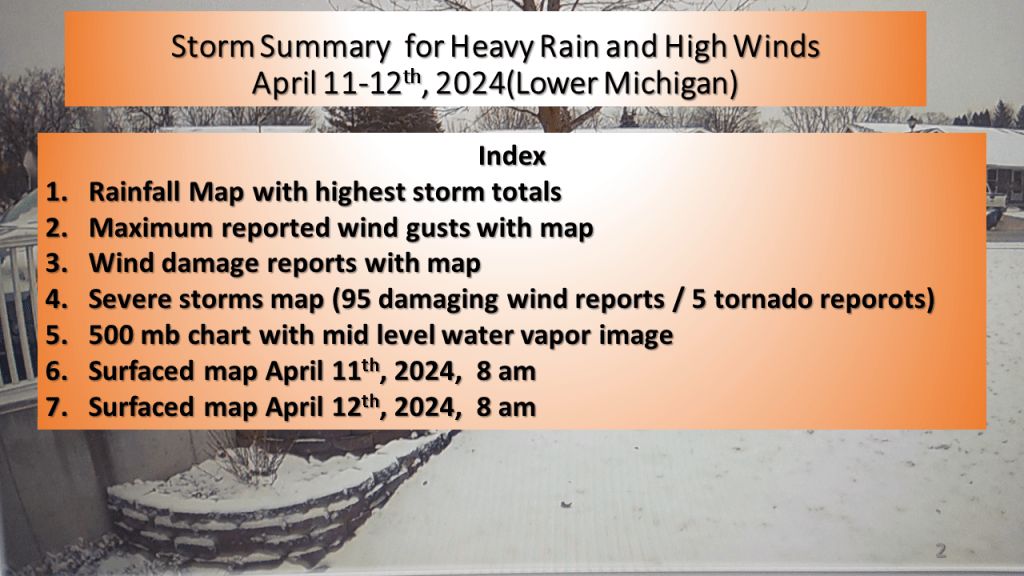
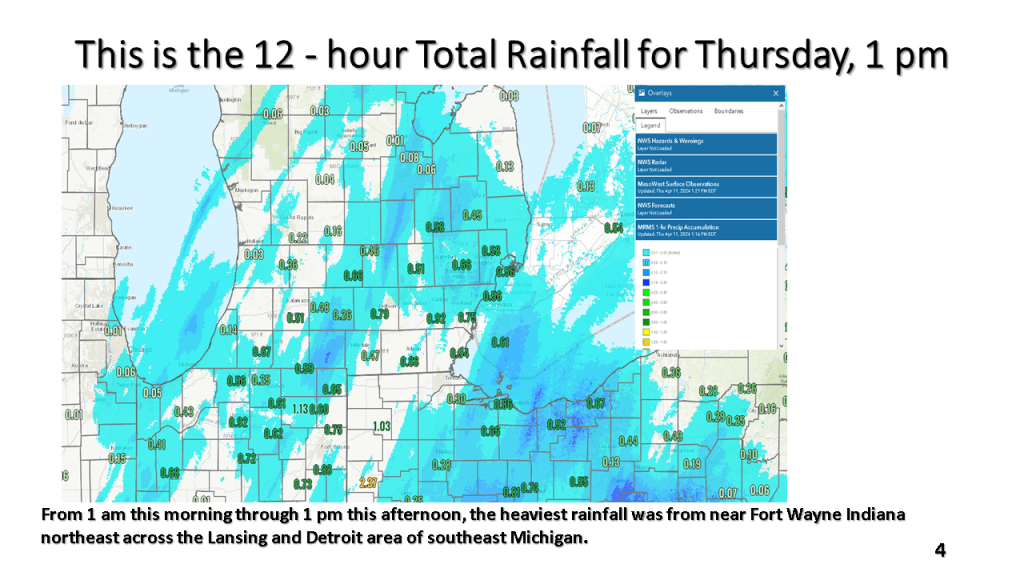
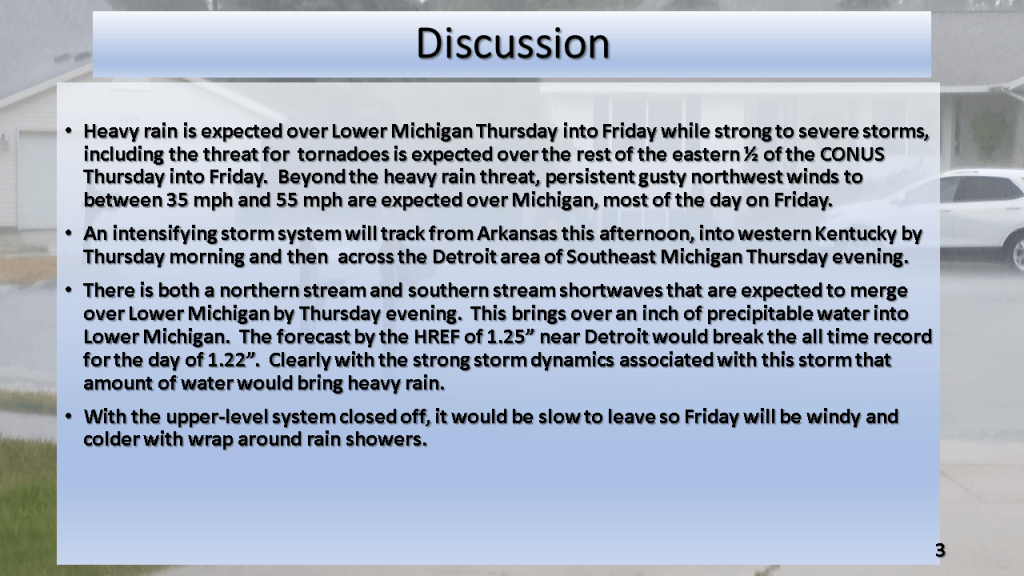
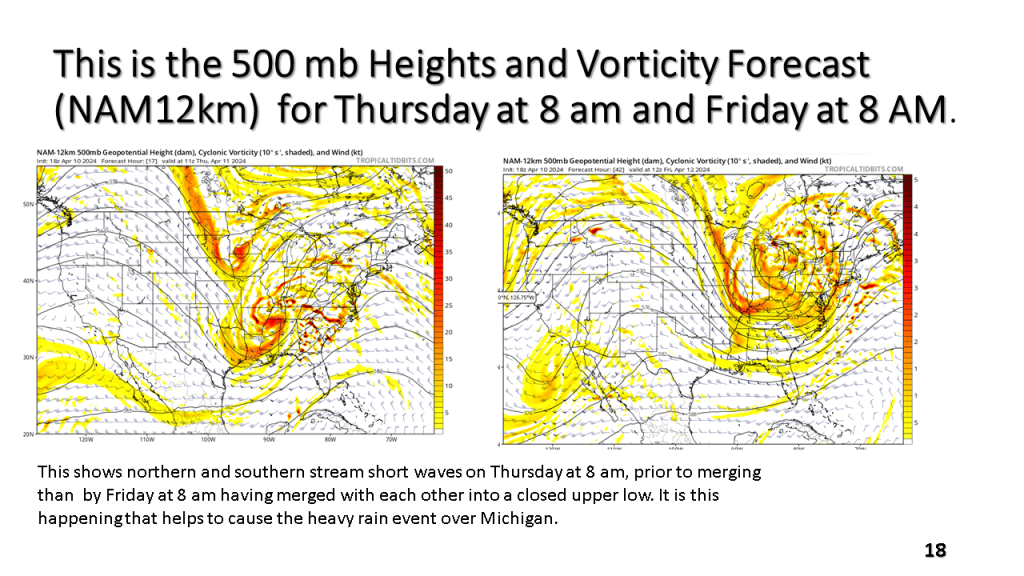
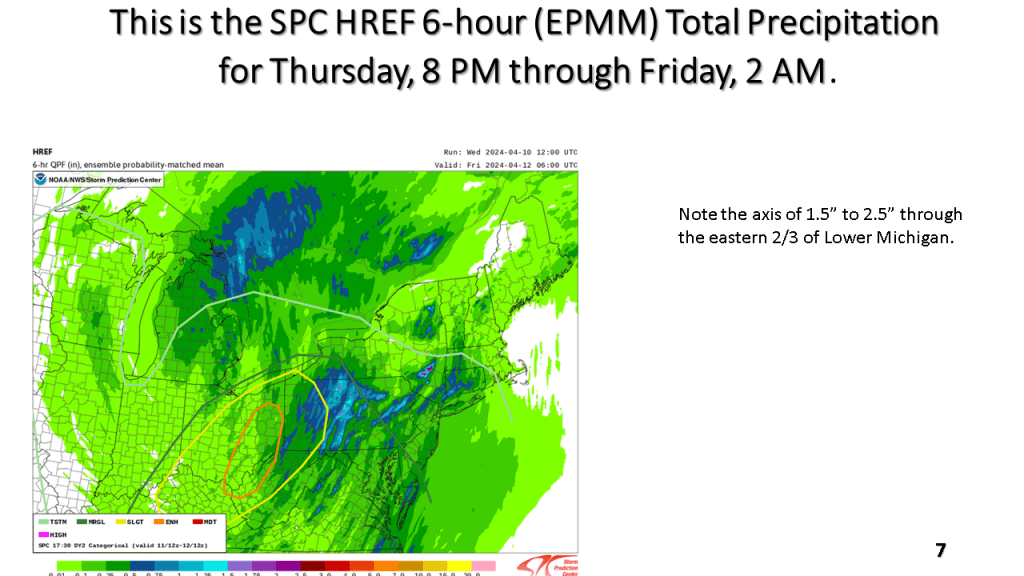
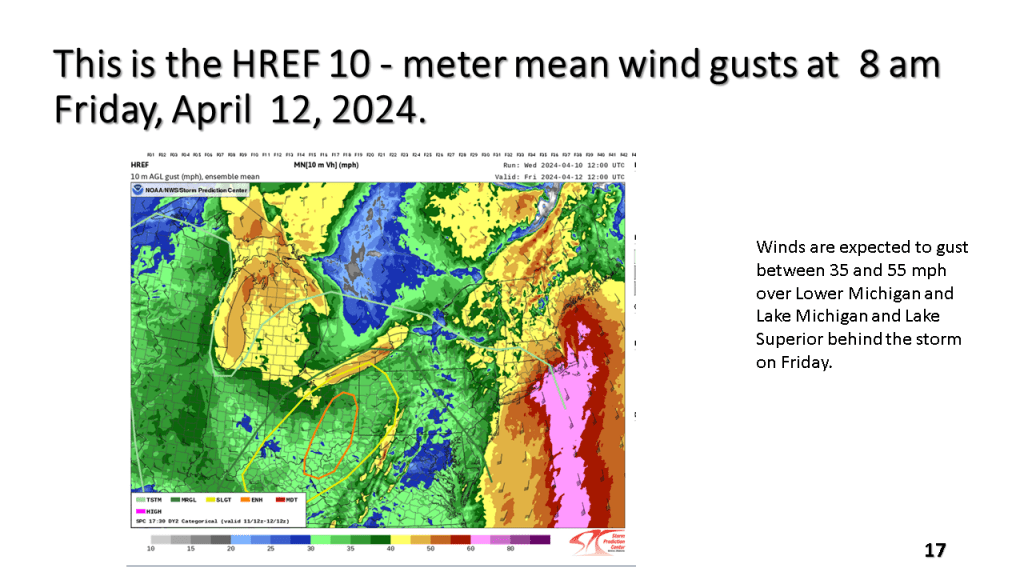
One to two inches of rain fell over a good part of Lower Michigan during this time. A rapidly deepening surface low tracked north across Lake Huron Friday, April 12, 2024 deepening below 980MB by late in the morning. This resulted in winds gusting to 40 to 60 mph across most of the area.



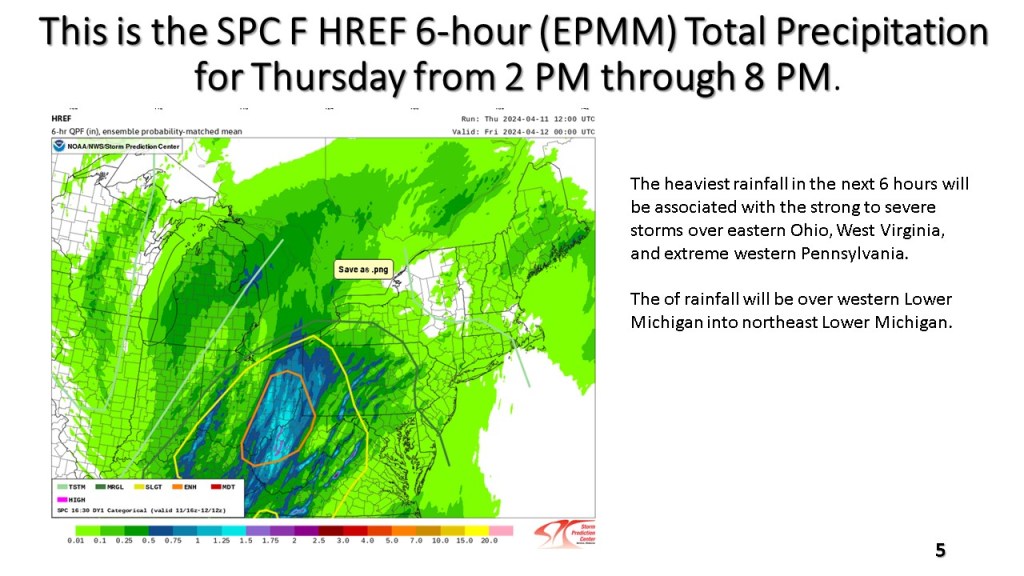

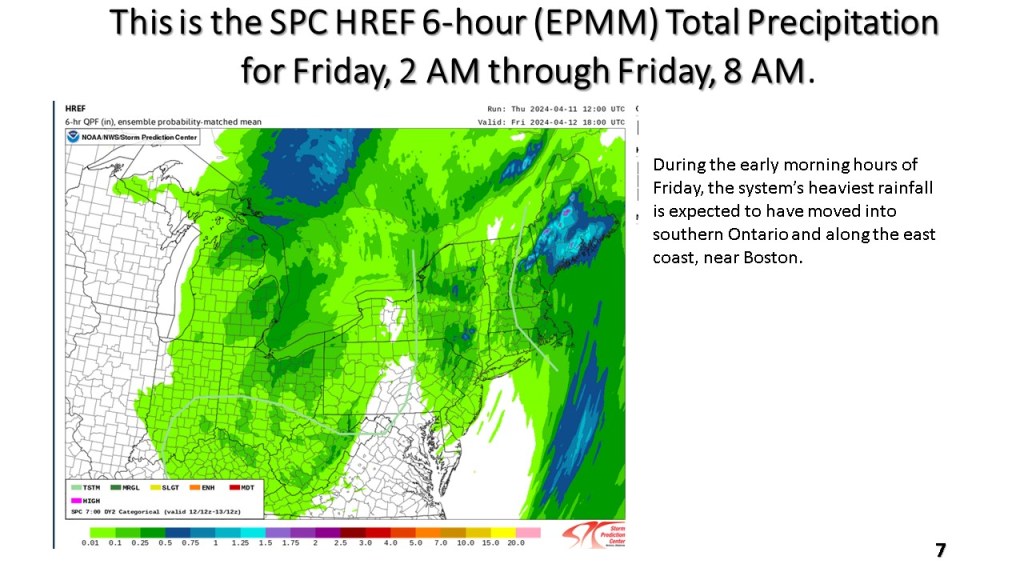

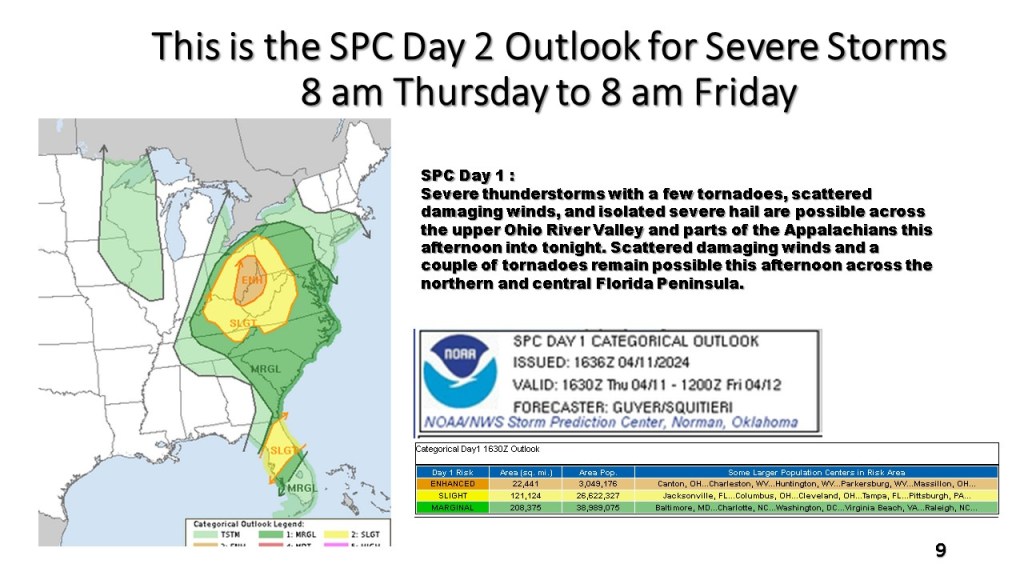


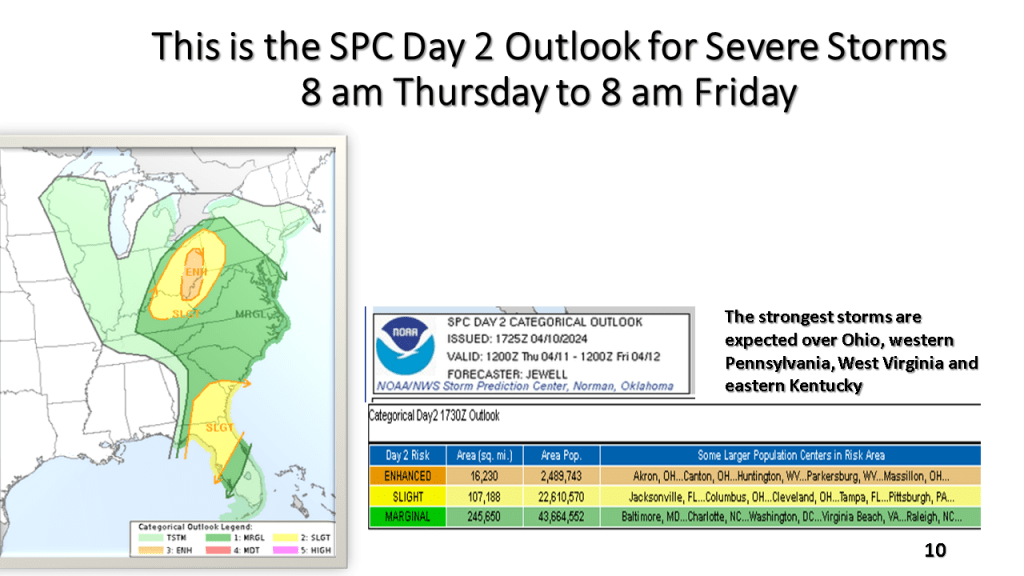
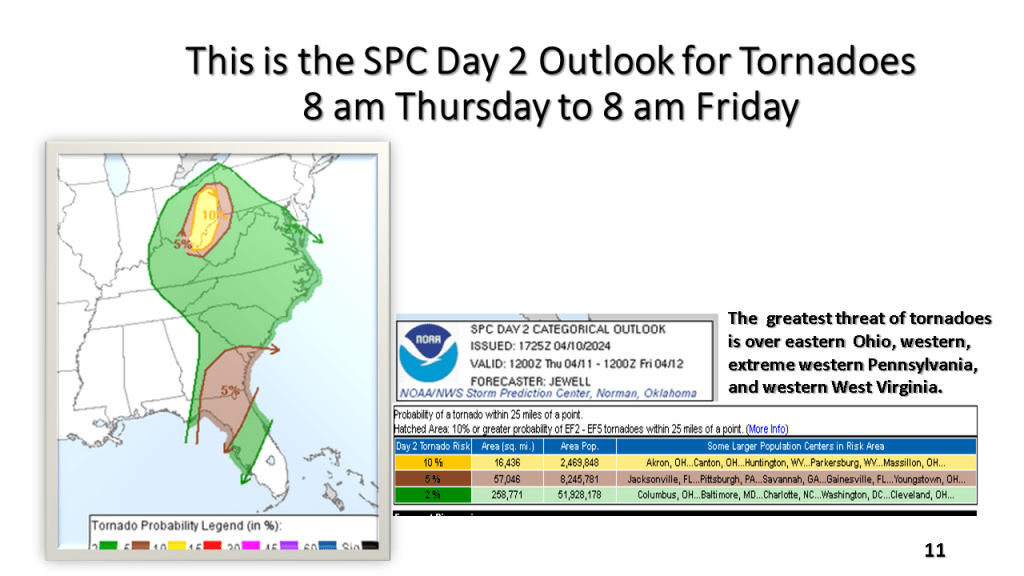
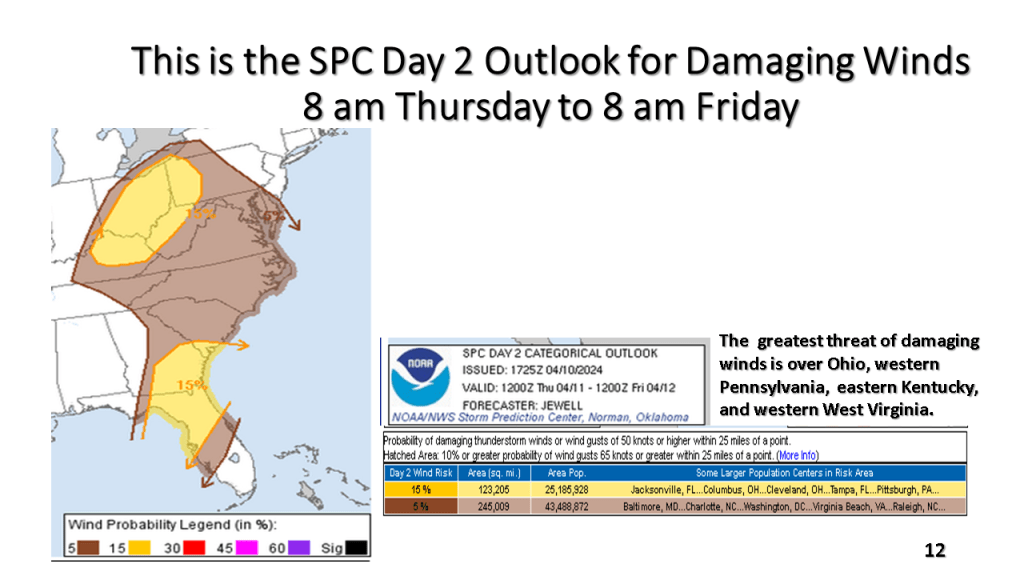
South of Michigan there is an enhanced risk for severe thunderstorms, including tornadoes over Ohio, western Pennsylvanian, West Virginia, and Kentucky.










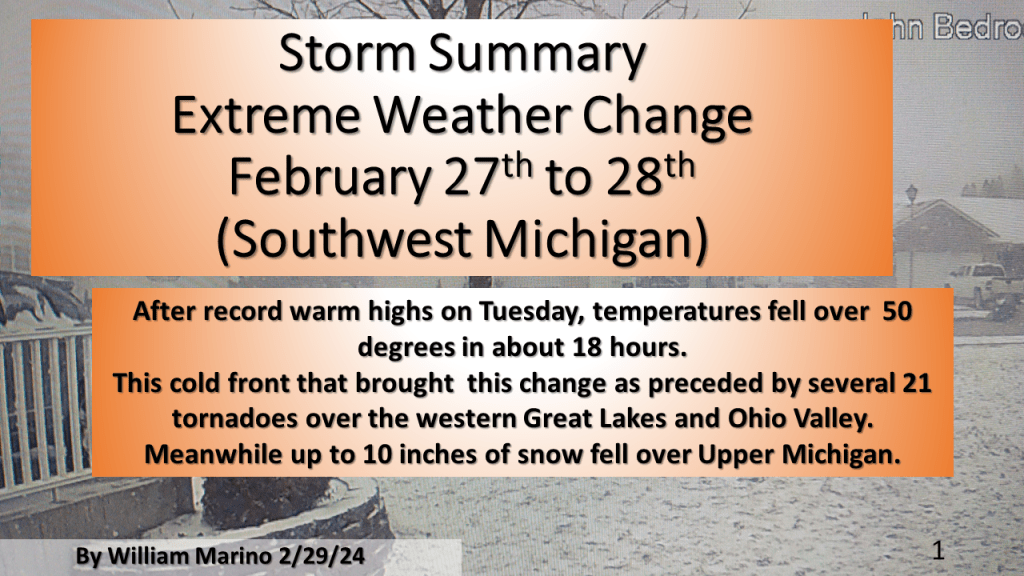
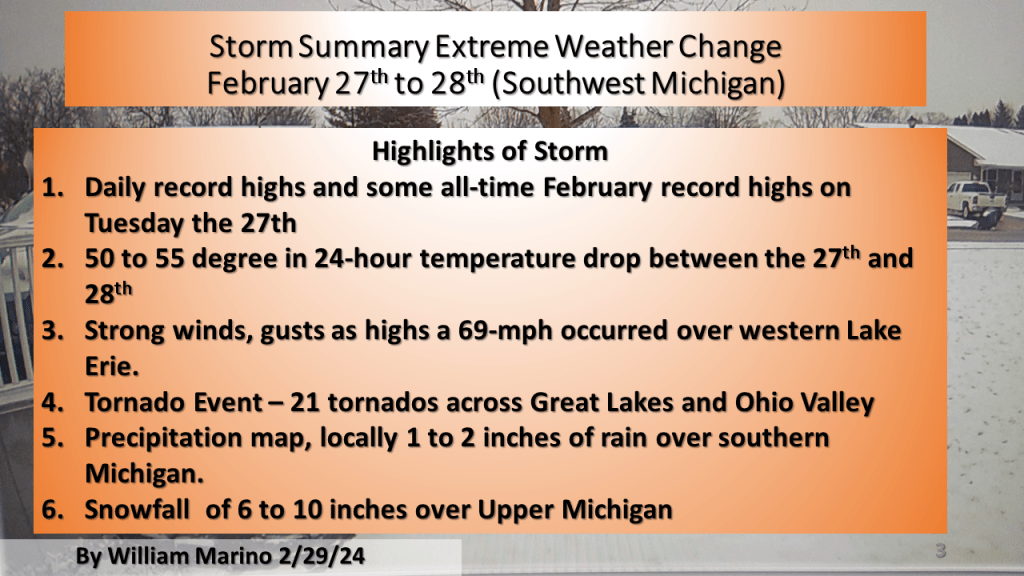
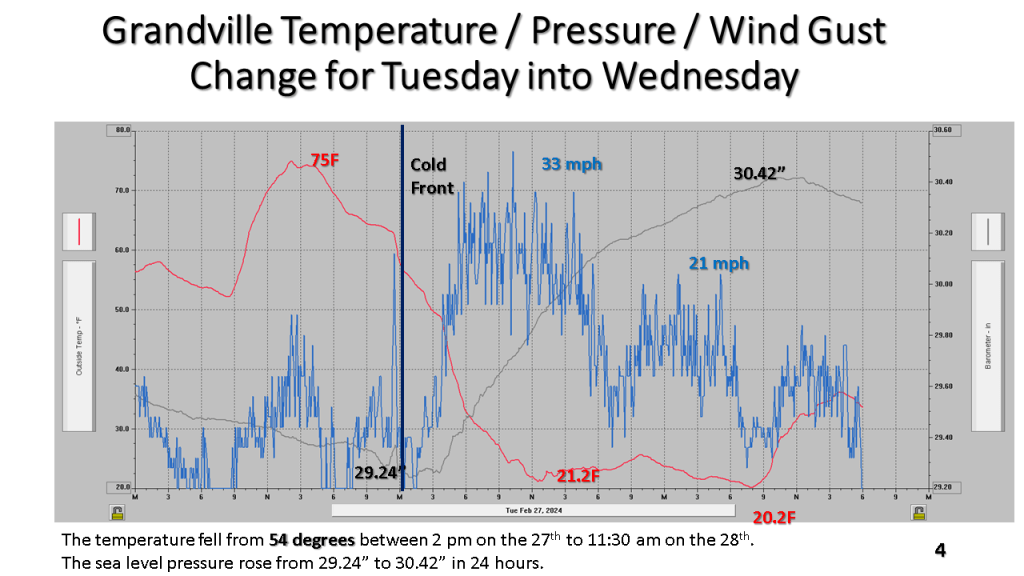
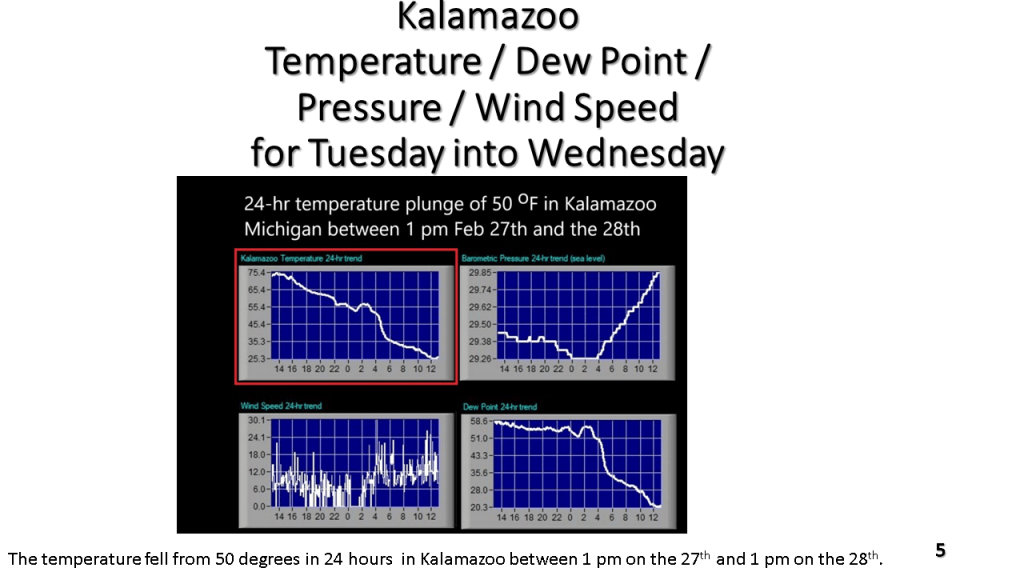
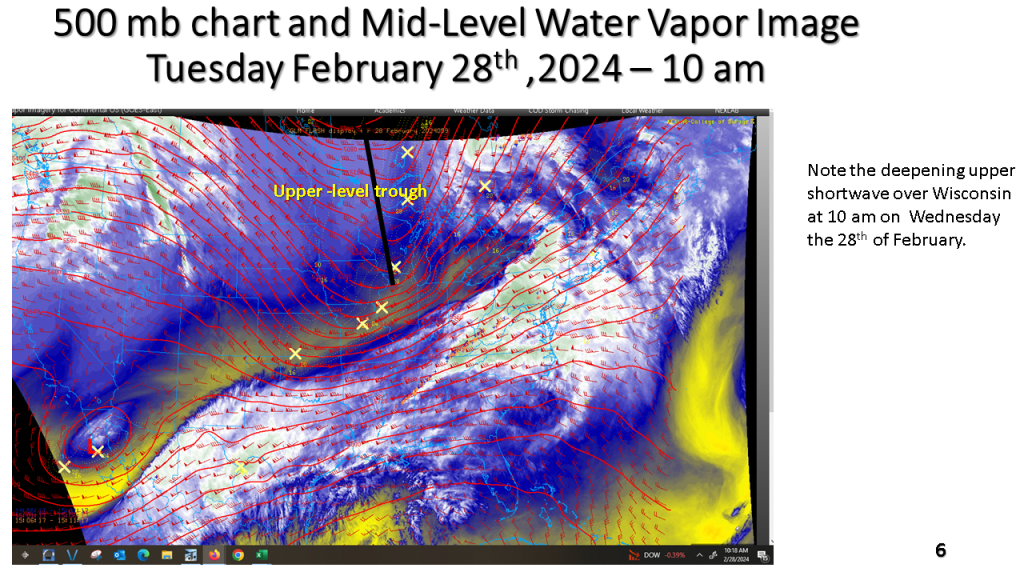
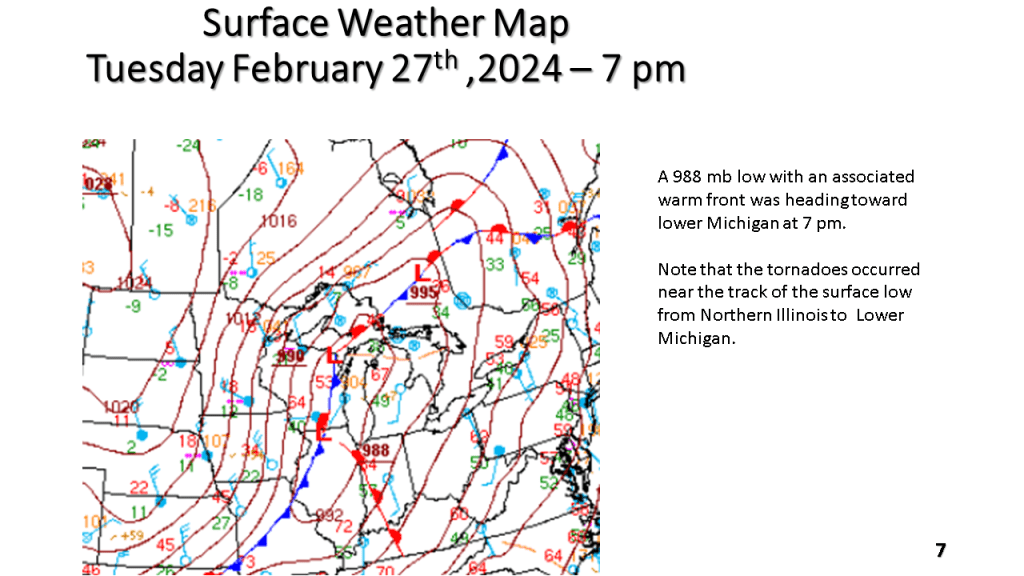
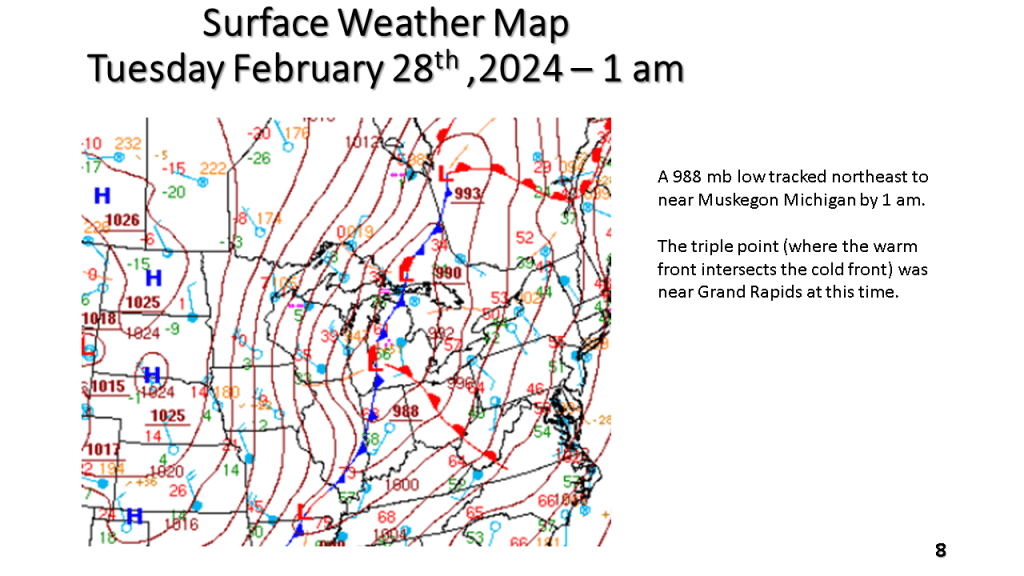
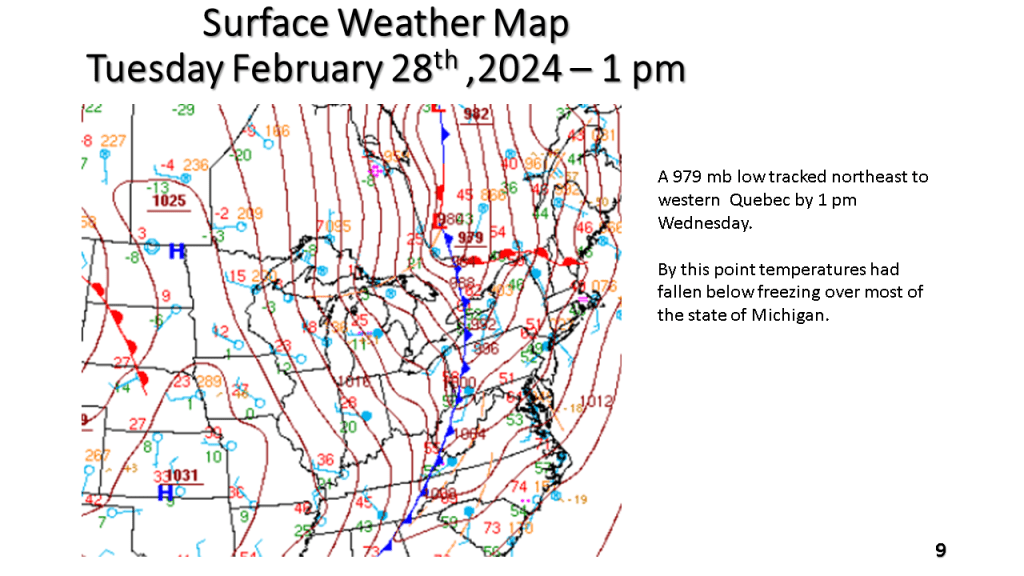
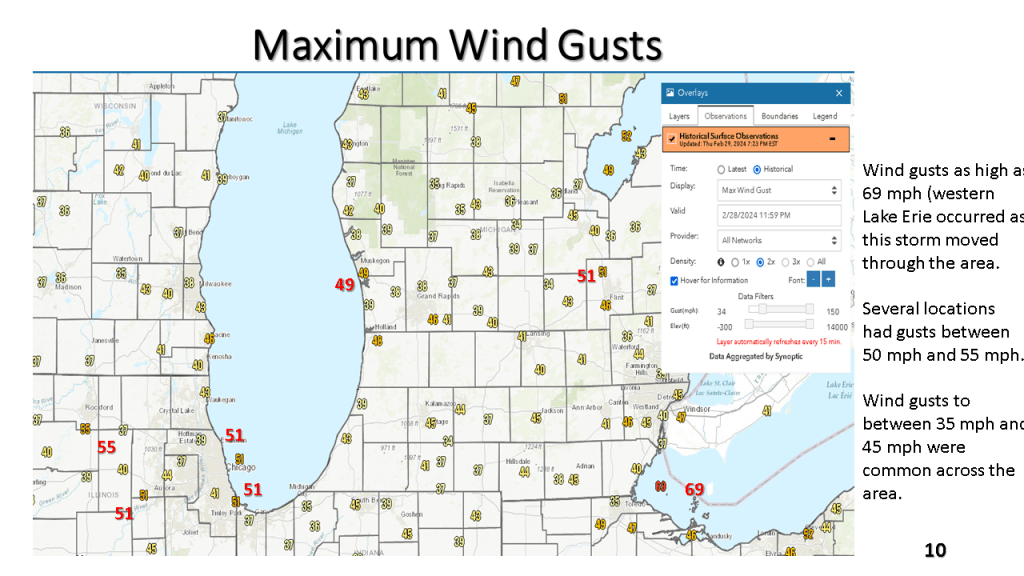
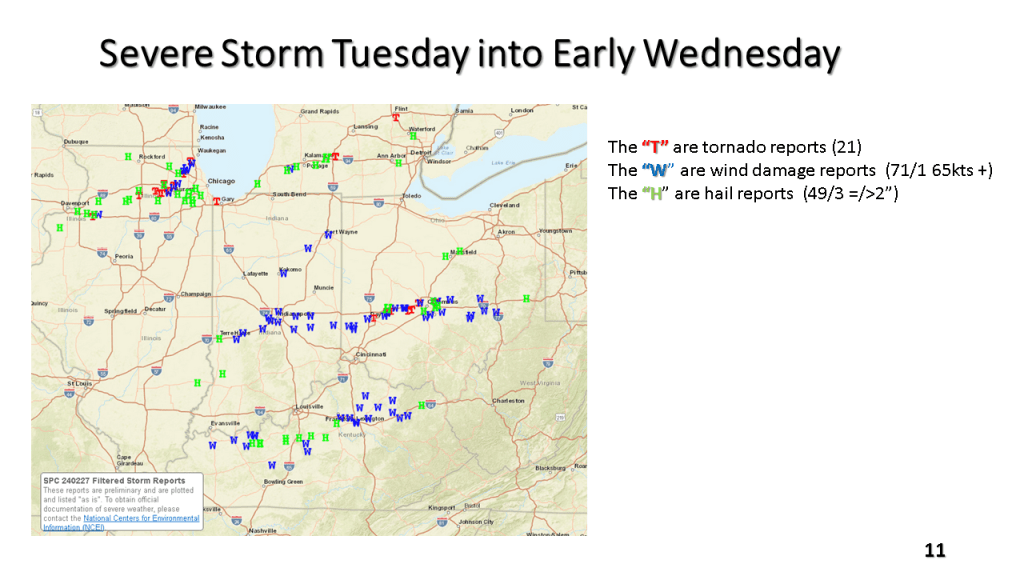
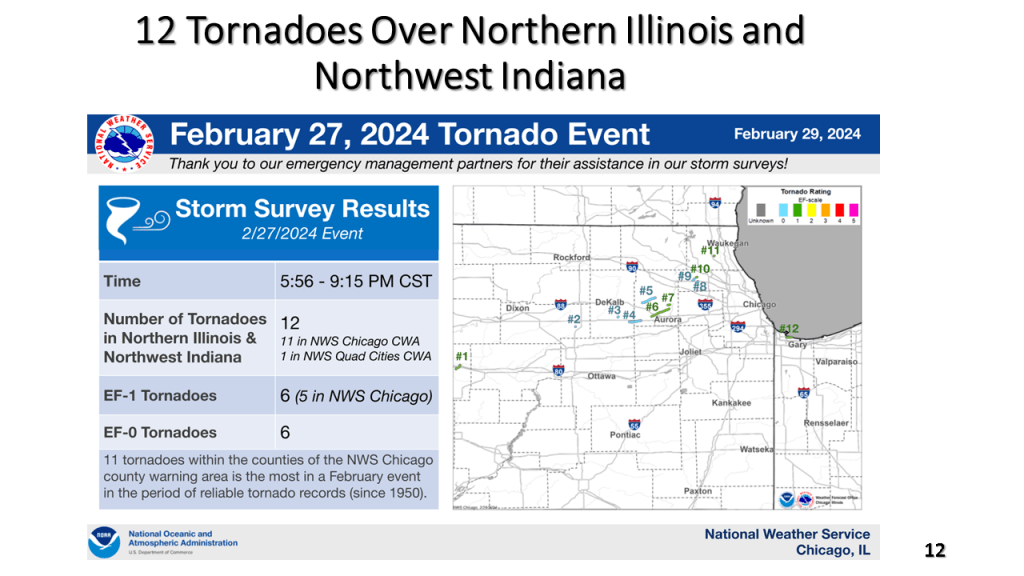
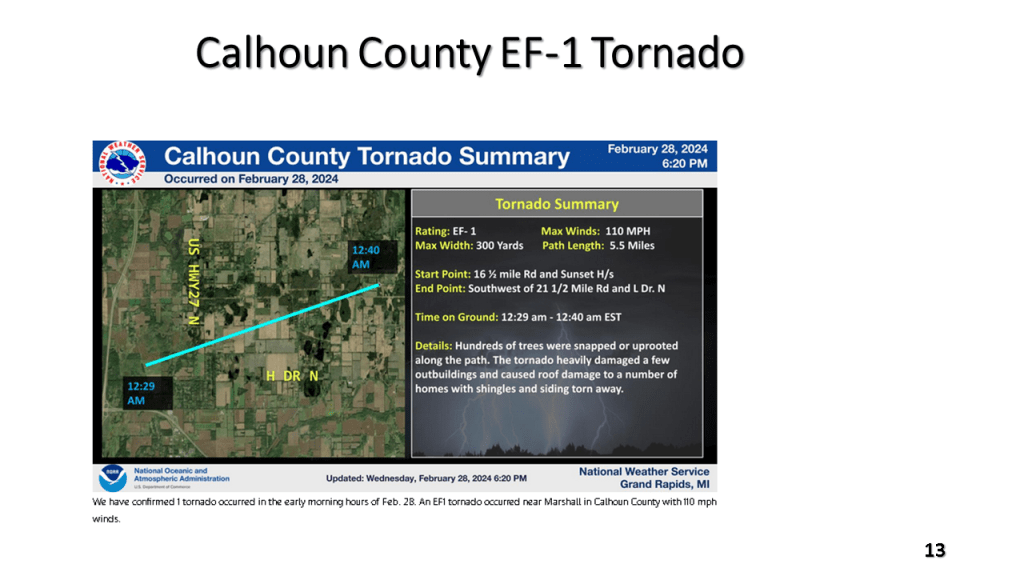
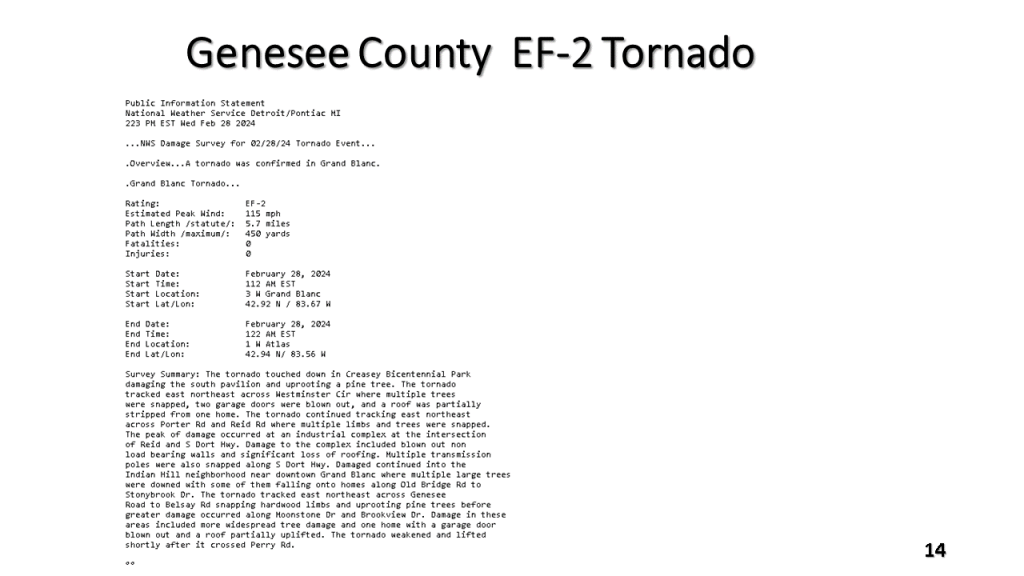
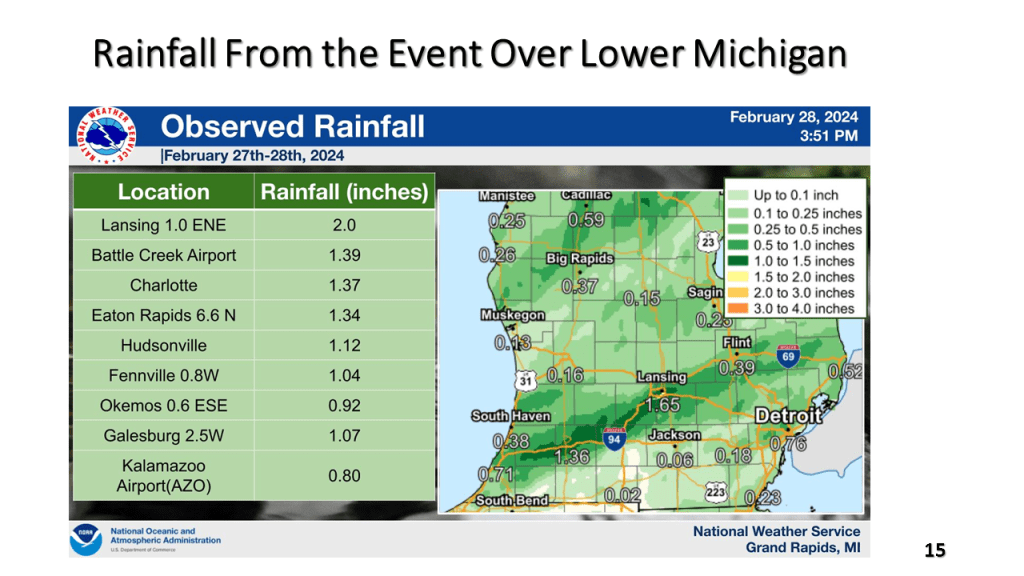
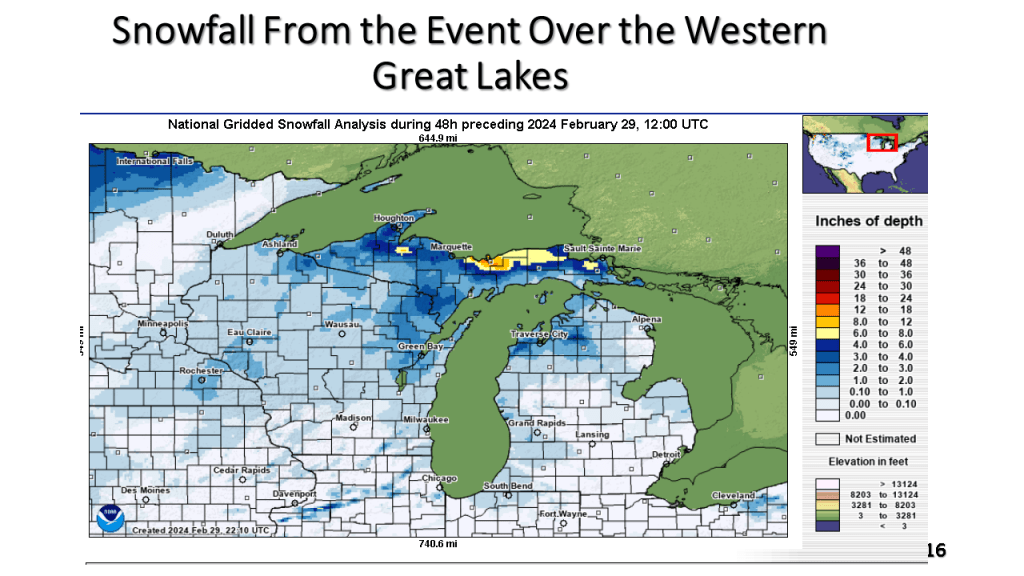
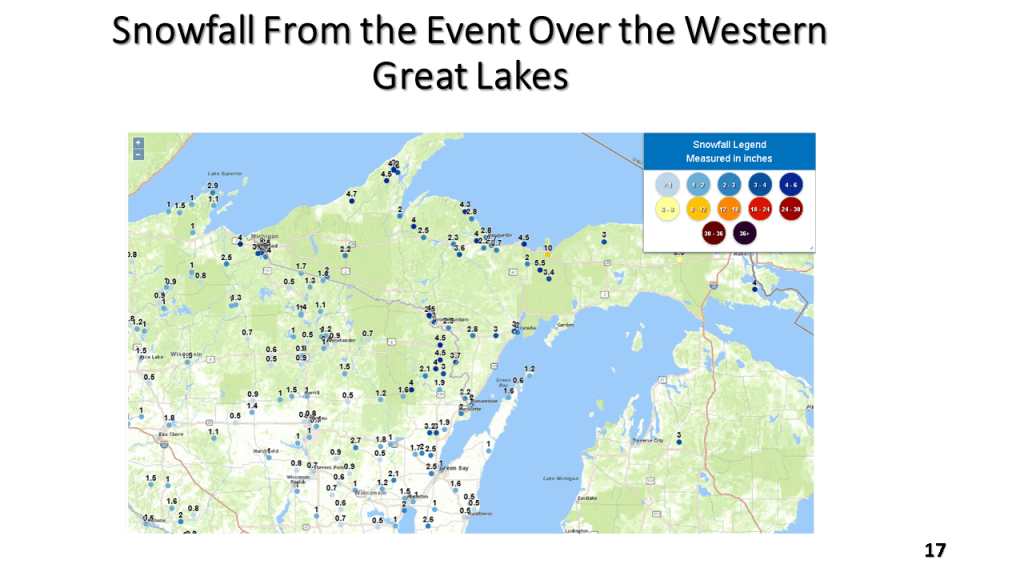
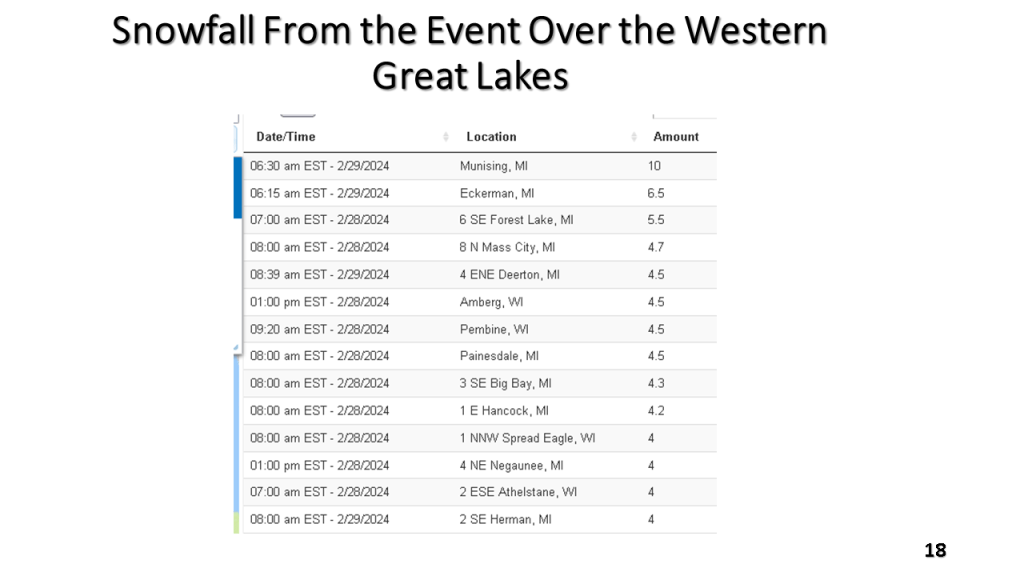
Record high temperatures ( many cases all time record highs for February) were quickly brought to an end by a strong late February cold front. There were 21 reported tornadoes, mostly EF-0 and EF-1 but there was an EF-2 near Grand Blanc in Geneses County just ahead of the cold front. Temperatures fell around 50 degrees between Tuesday afternoon and Wednesday afternoon over Lower Michigan. There was 6 to 10 inches of snow in upper Michigan and locally 1 to 2 inches of rain in parts of southern Lower Michigan. Winds gusted to 69 mph over western Lake Erie.

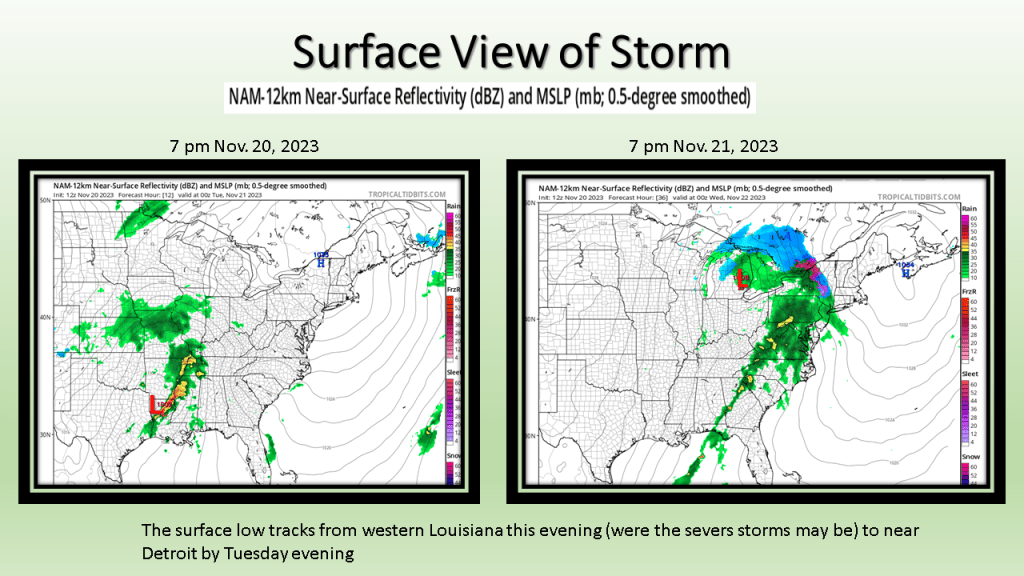
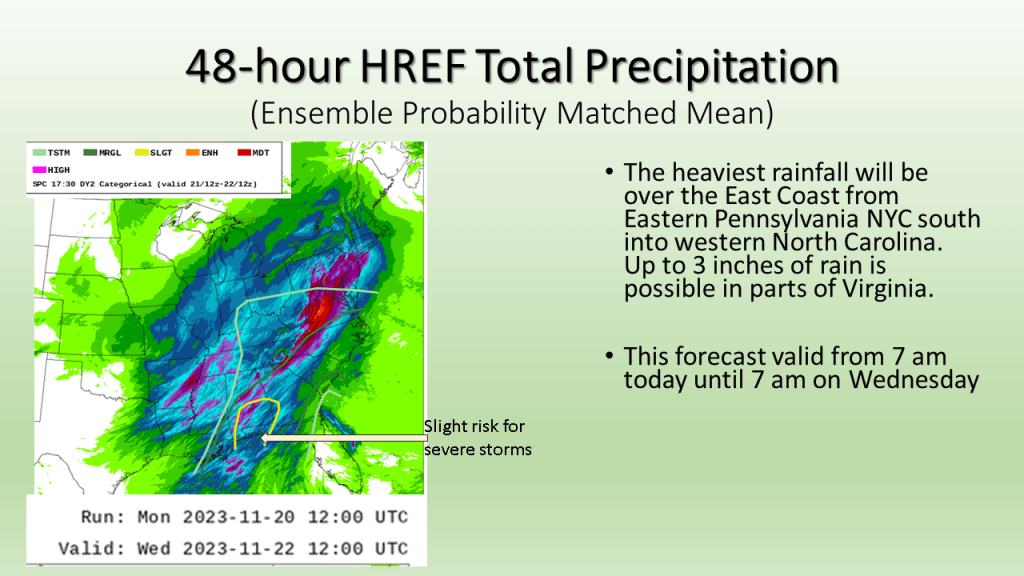
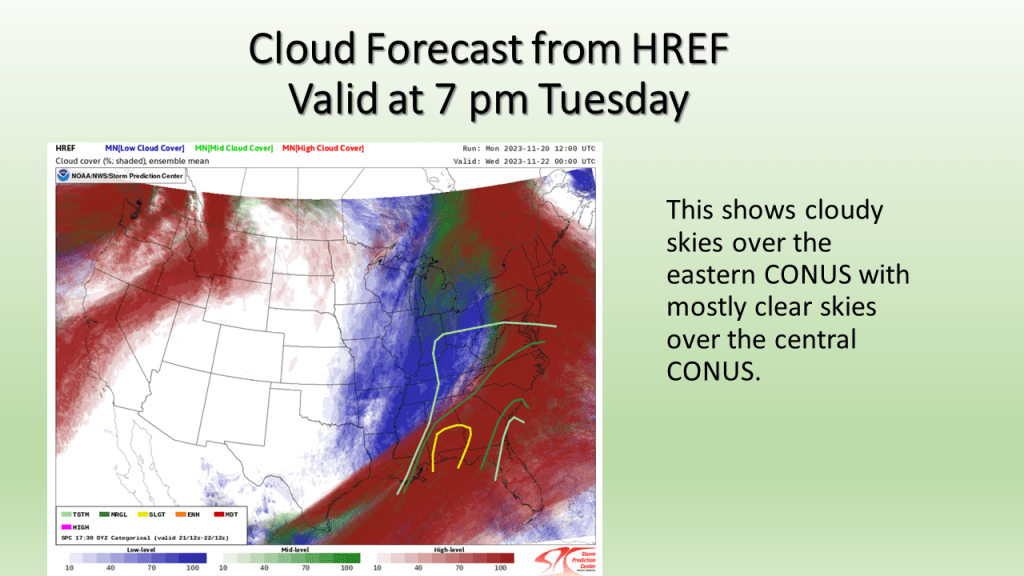
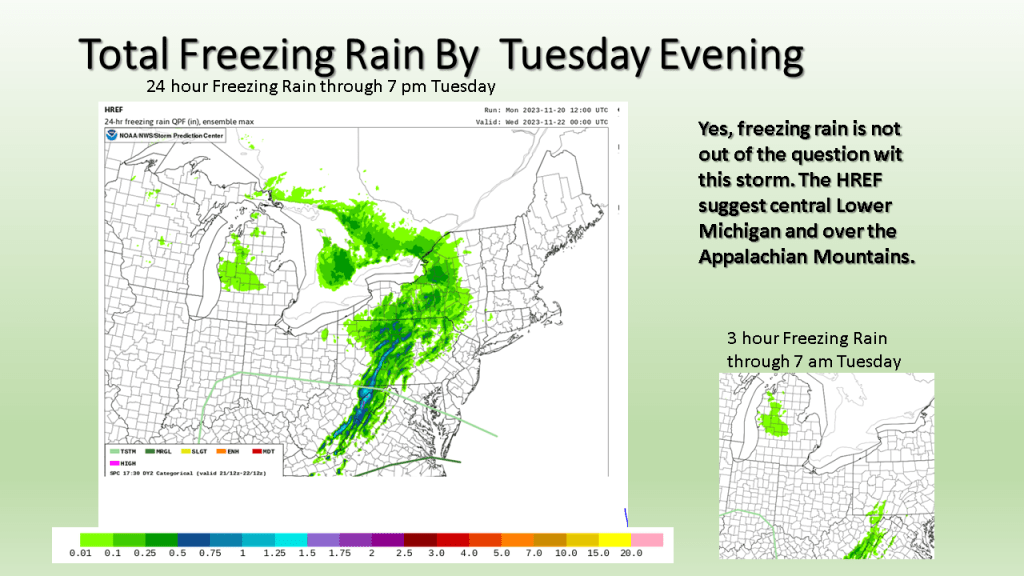
This blog is really more about showing those who do not know about the SPC HREF model. I have some of the key charts from today’s HREF that show where the severe storms are expected, the strongest winds, and heaviest rainfall.
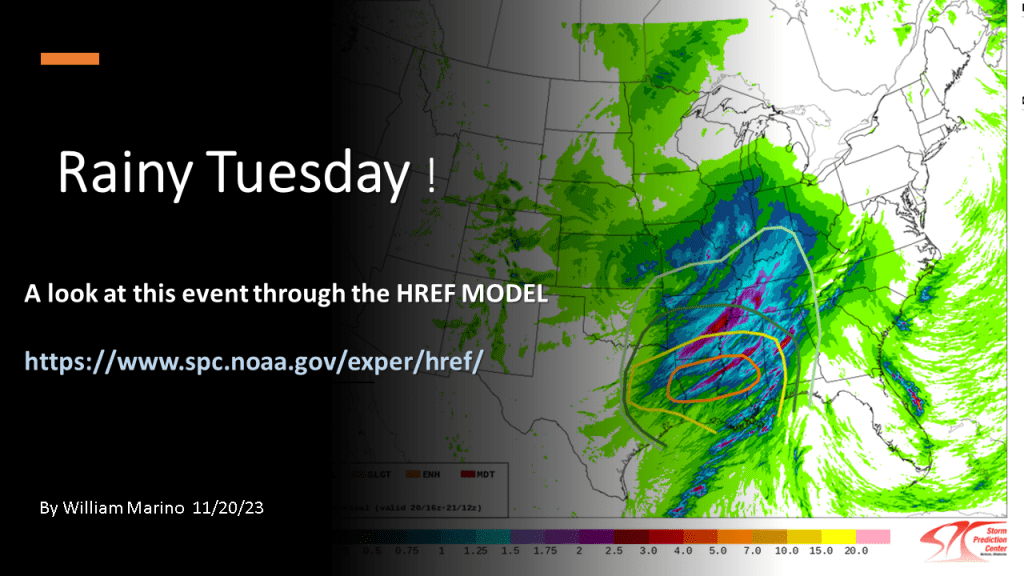
Here is a link to the SPC HREF model.



 themarinocast