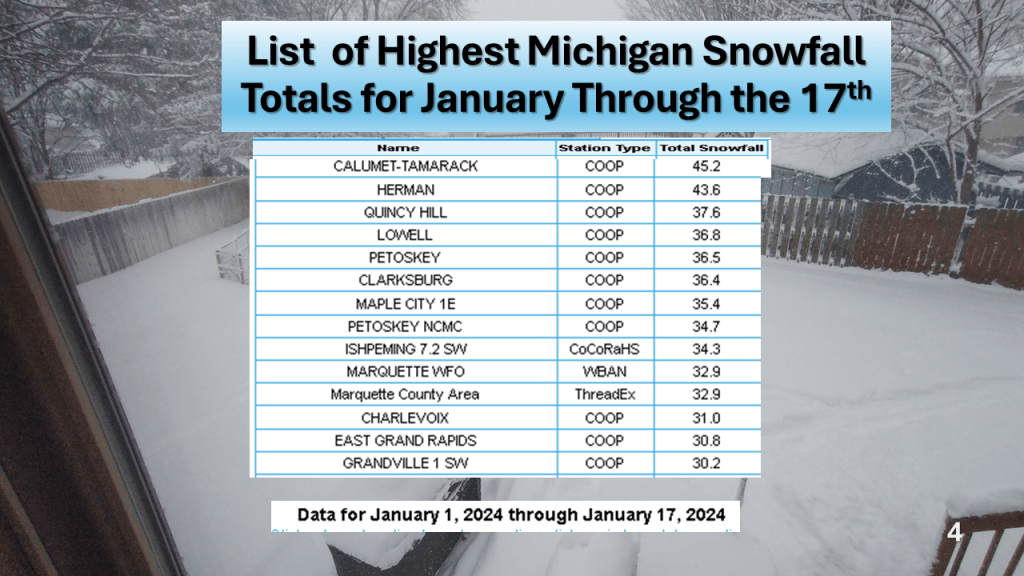
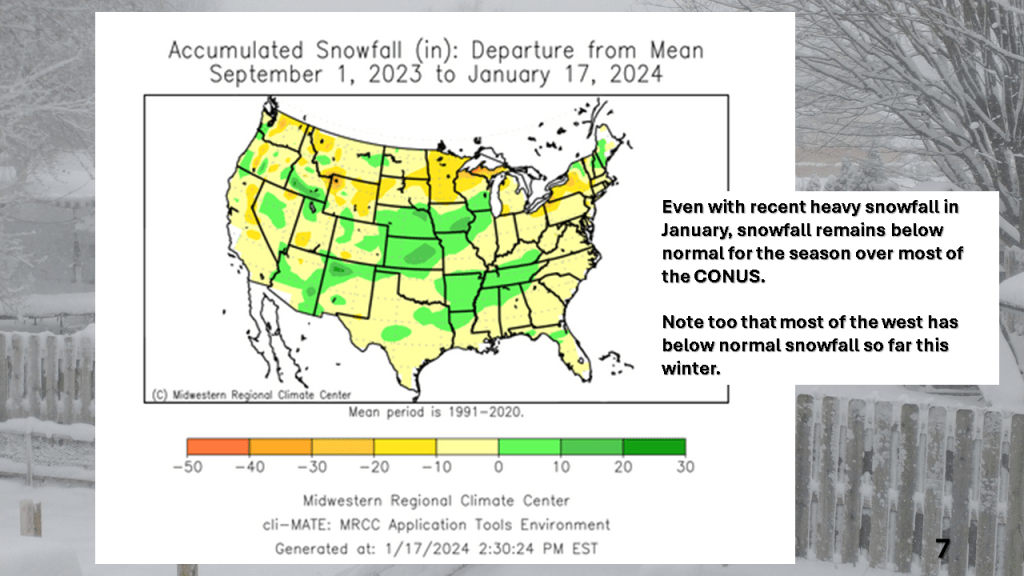
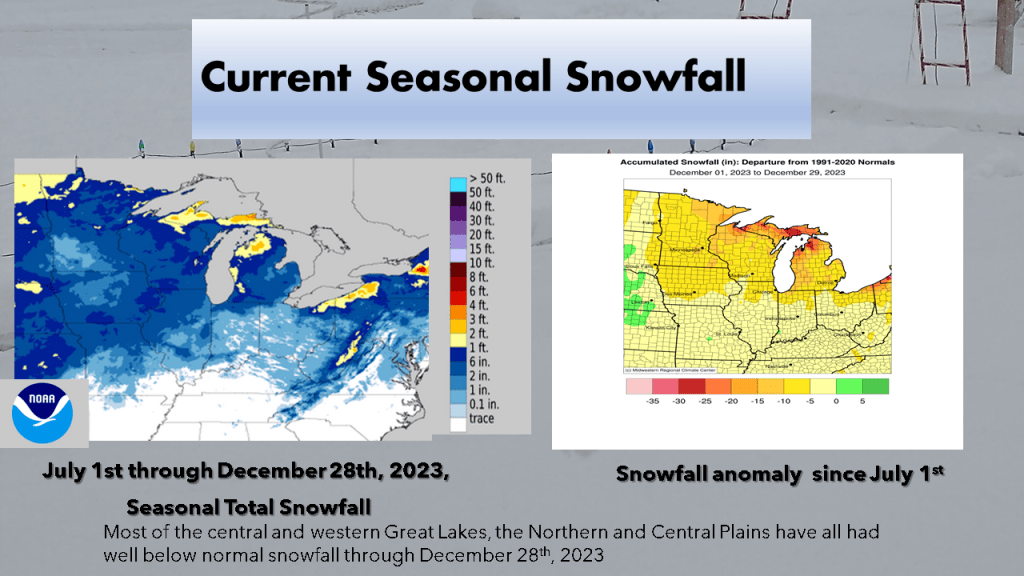
Over Michigan, November and December featured well below normal snowfall. The first 2 1/2 weeks of January seem to be making up some of that deficit. Over the rest of the CONUS, seasonal snowfall mostly remains below normal.


Over Michigan, November and December featured well below normal snowfall. The first 2 1/2 weeks of January seem to be making up some of that deficit. Over the rest of the CONUS, seasonal snowfall mostly remains below normal.
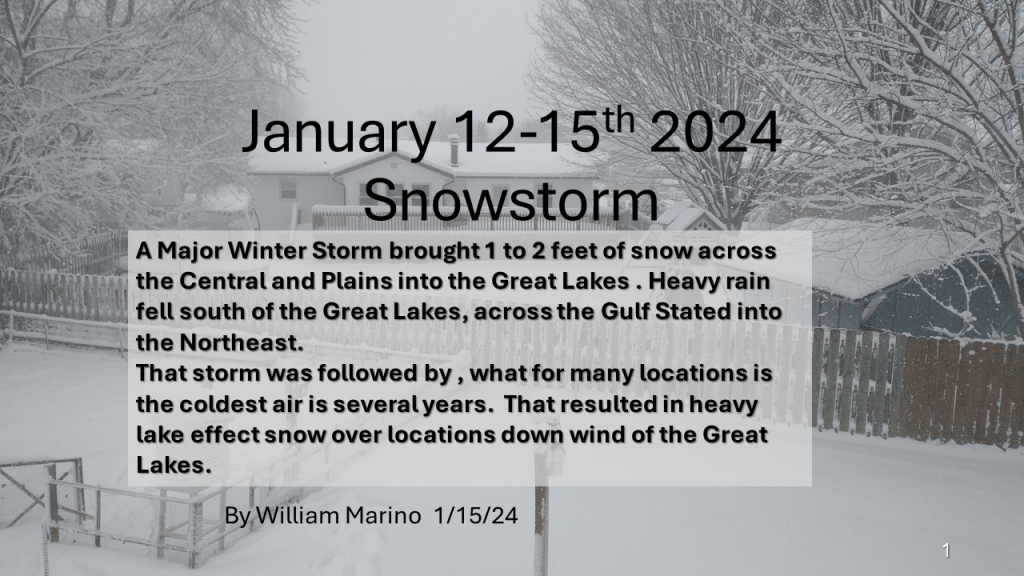
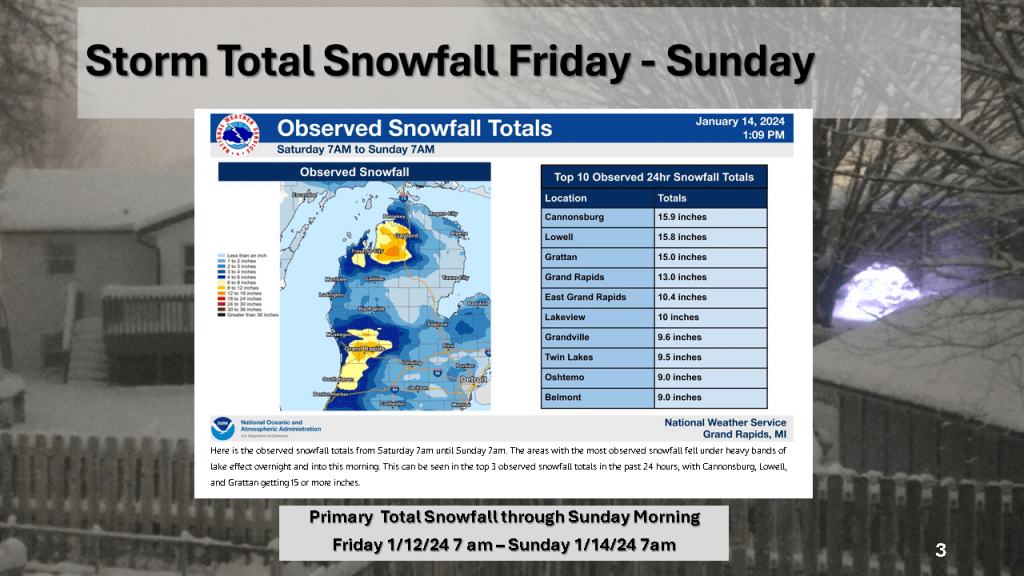
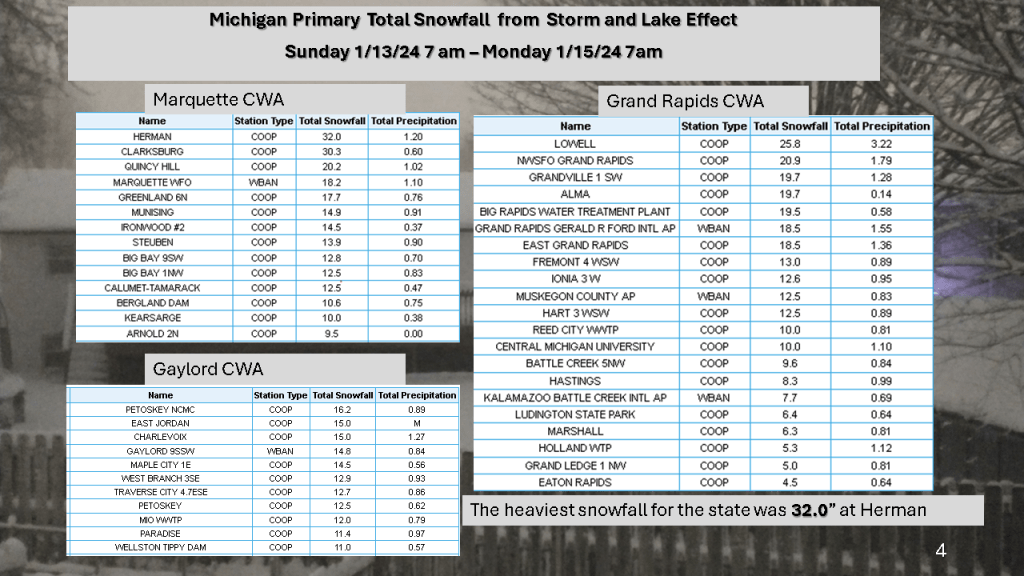
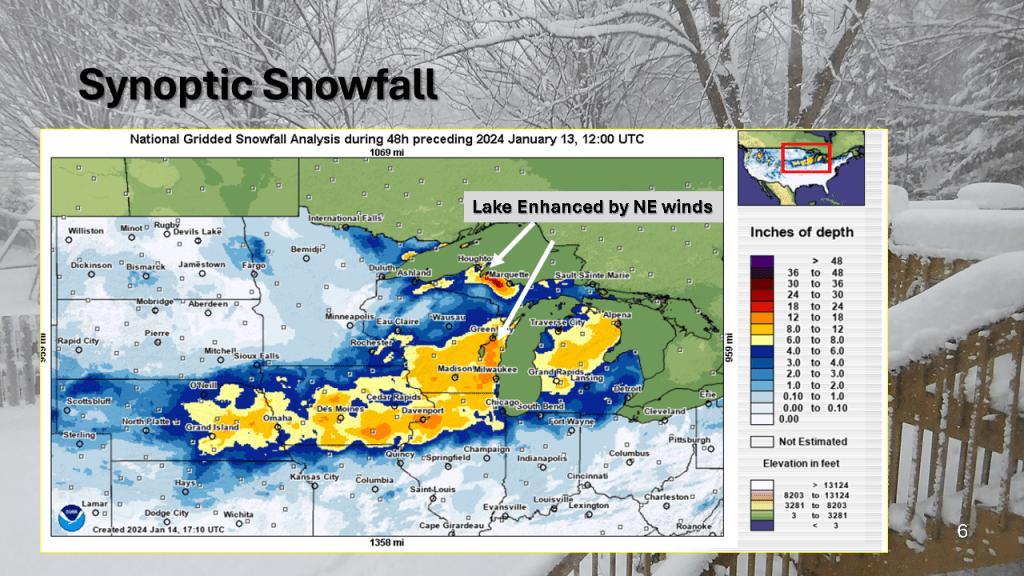
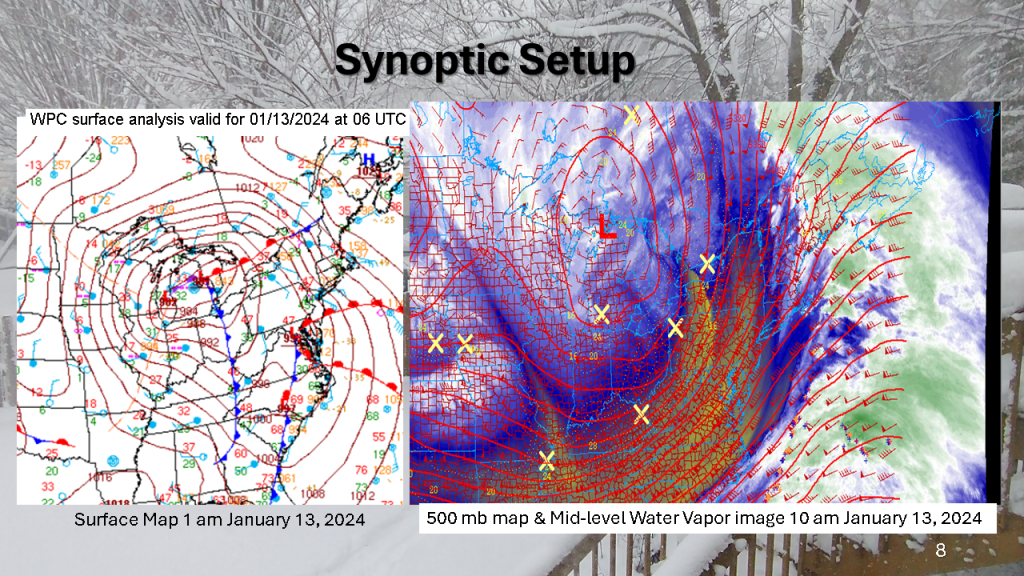
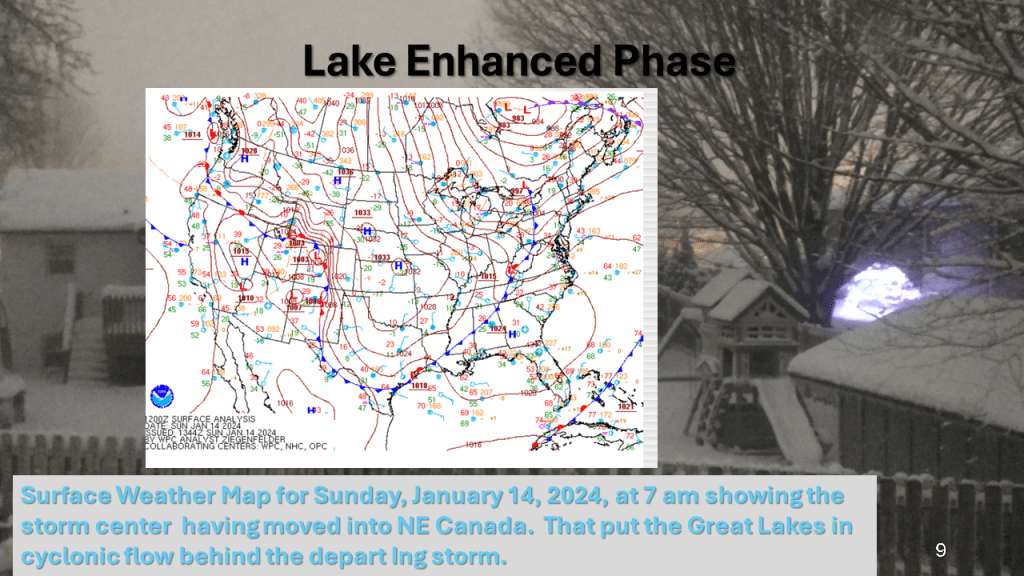
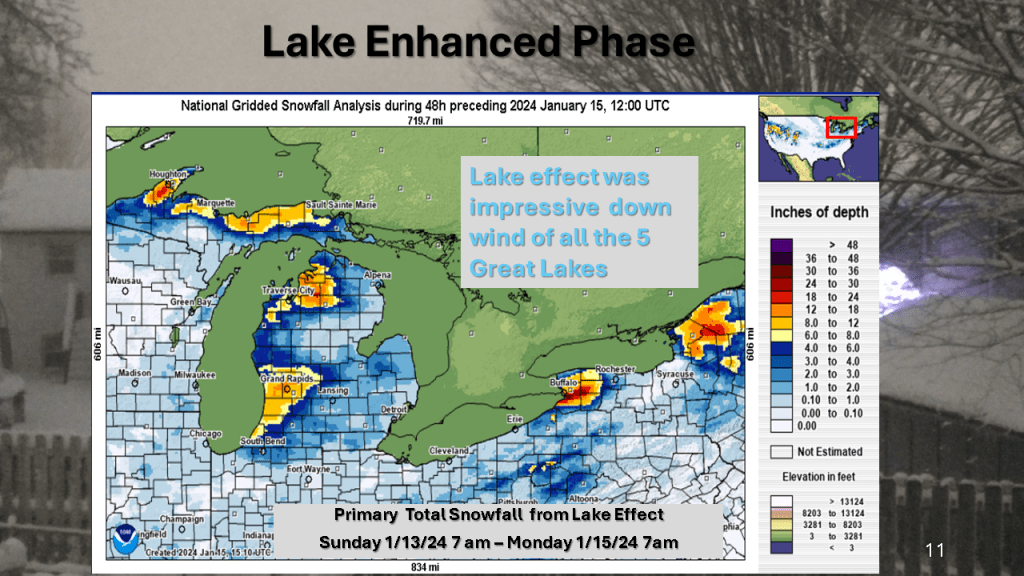
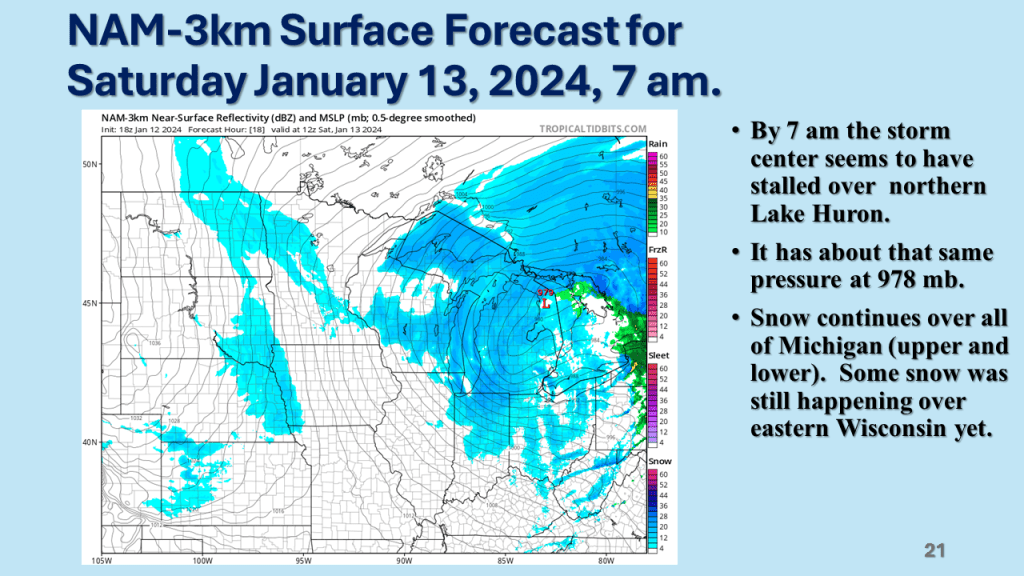
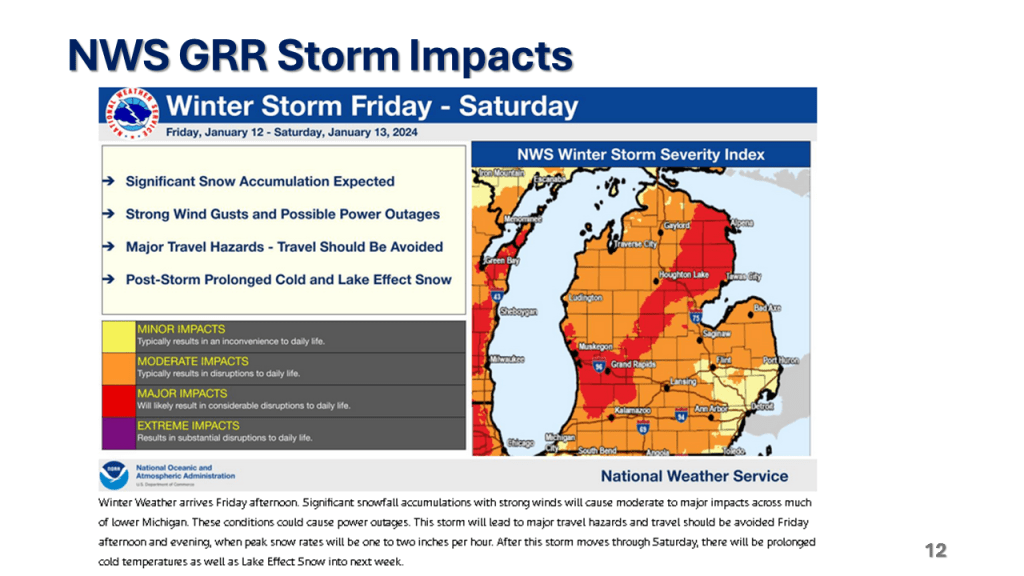
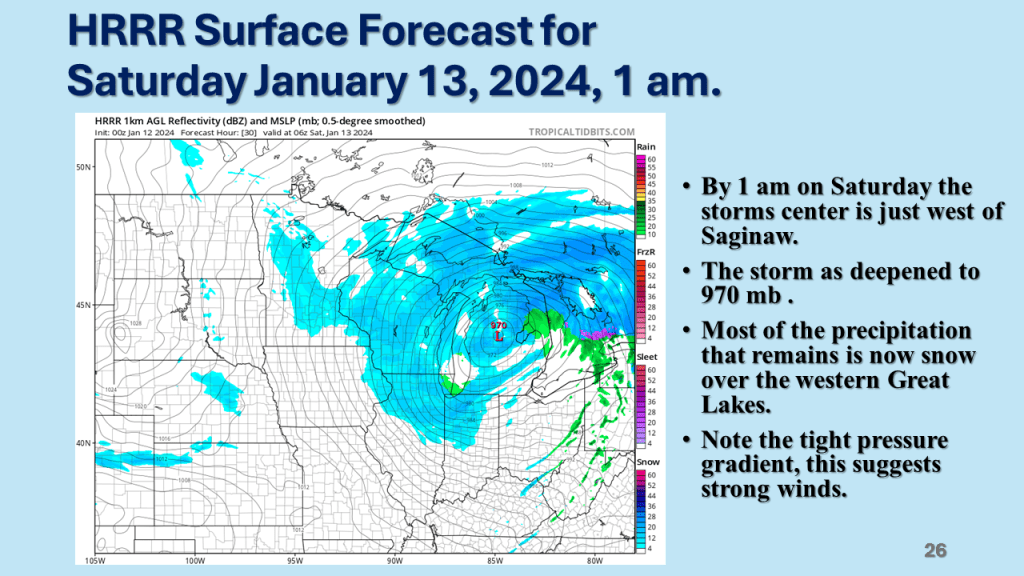
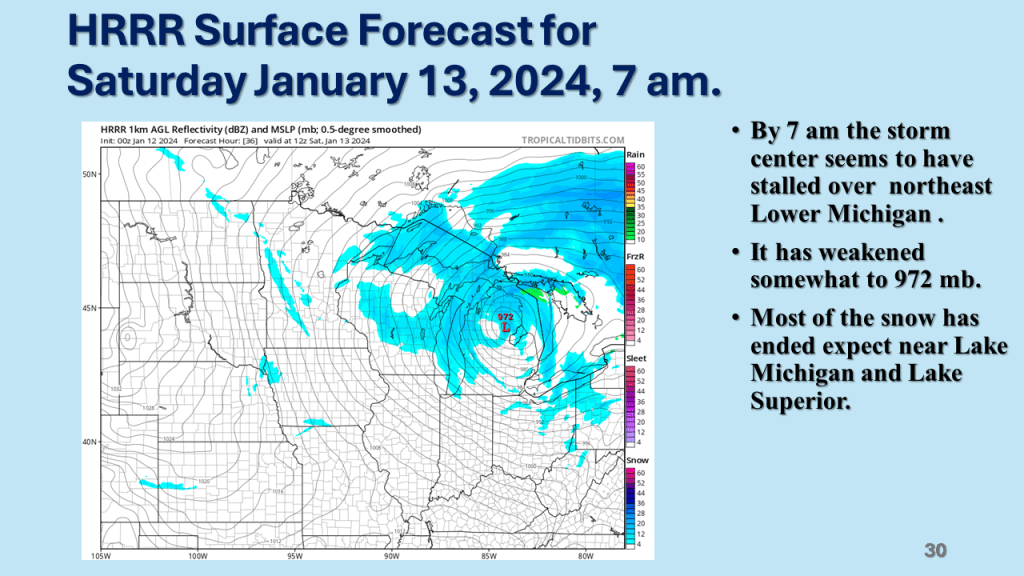
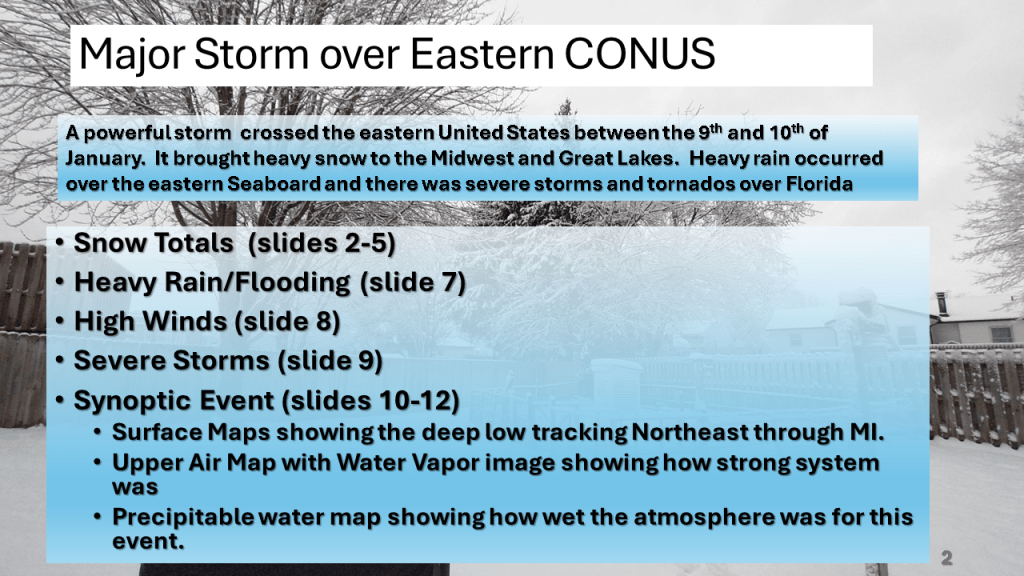
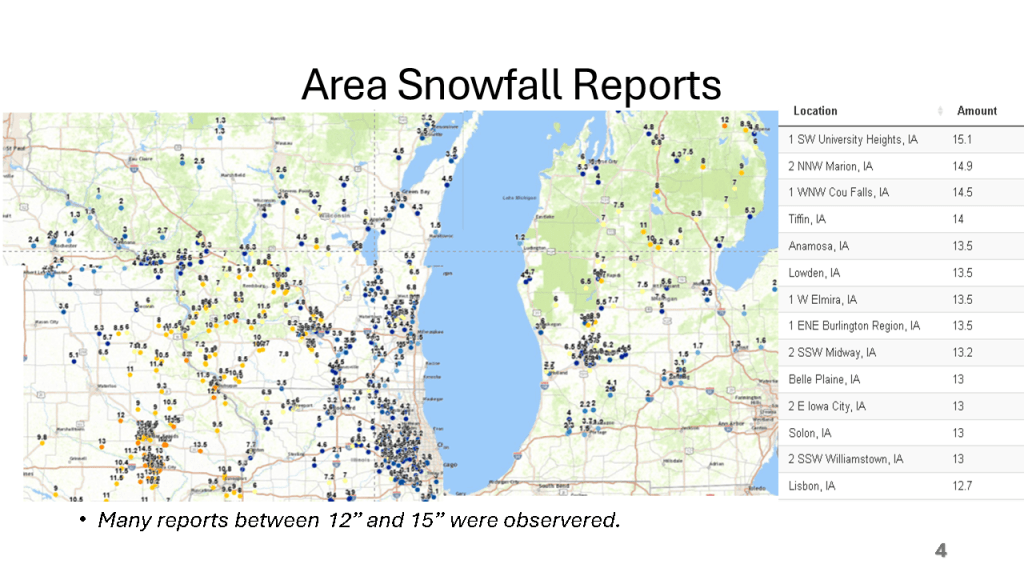
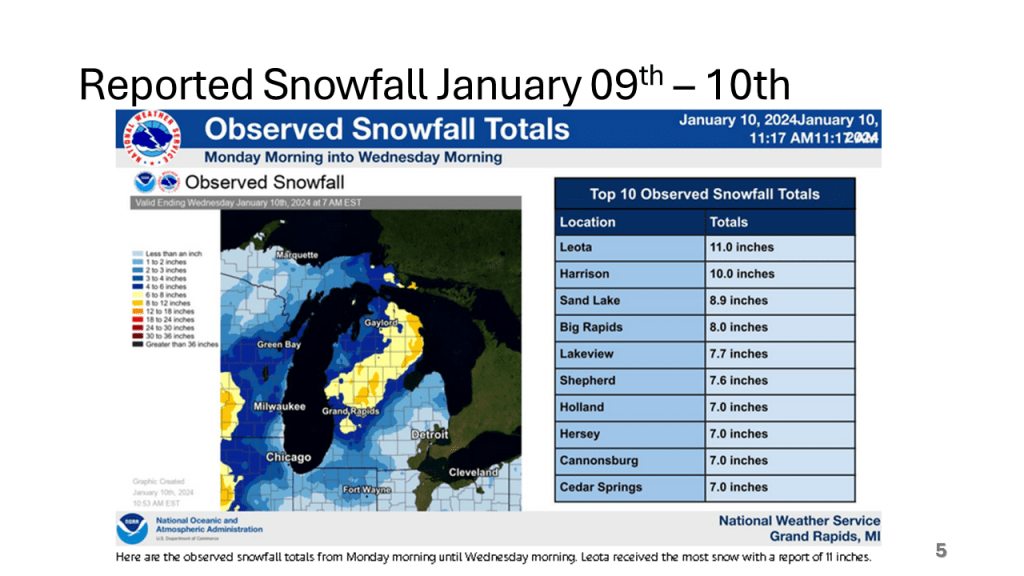
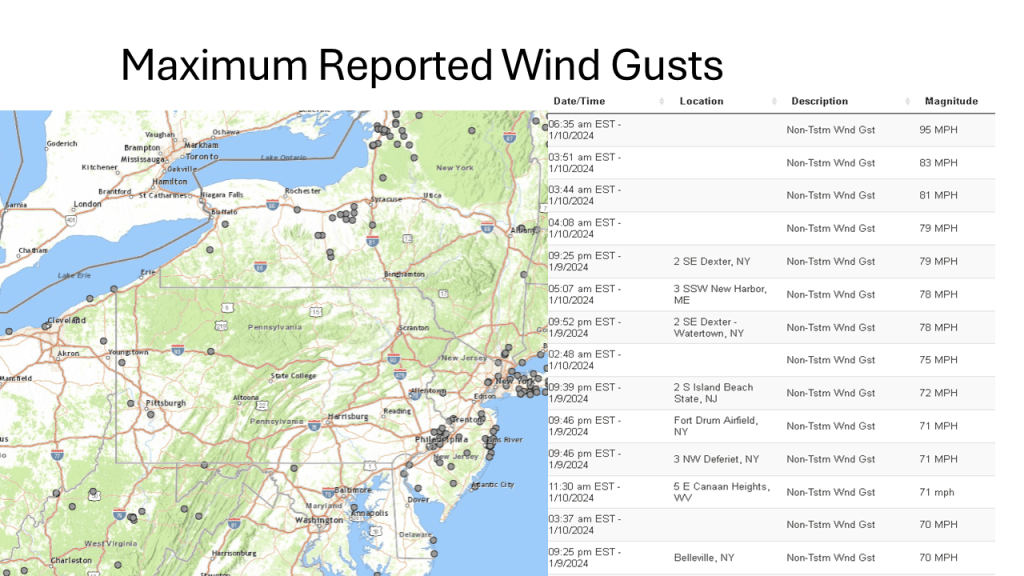
A rapidly deepening storm tracked Texas on Thursday afternoon to the northern Great Lakes by Saturday morning. The storm brought 1 to 2 feet of snow from Nebraska, across Iowa, Wisconsin then into Michigan. Strong winds accompanied the storm then the coldest air in several years followed the storm with dangerously cold wind chills over most of the Northern and Central Midwest. That cold air caused heavy lake effect snow in Michigan, near Buffalo New York and over the Tug Hill Plateau in the Adirondack Mountains, down wind of Lake Ontario.


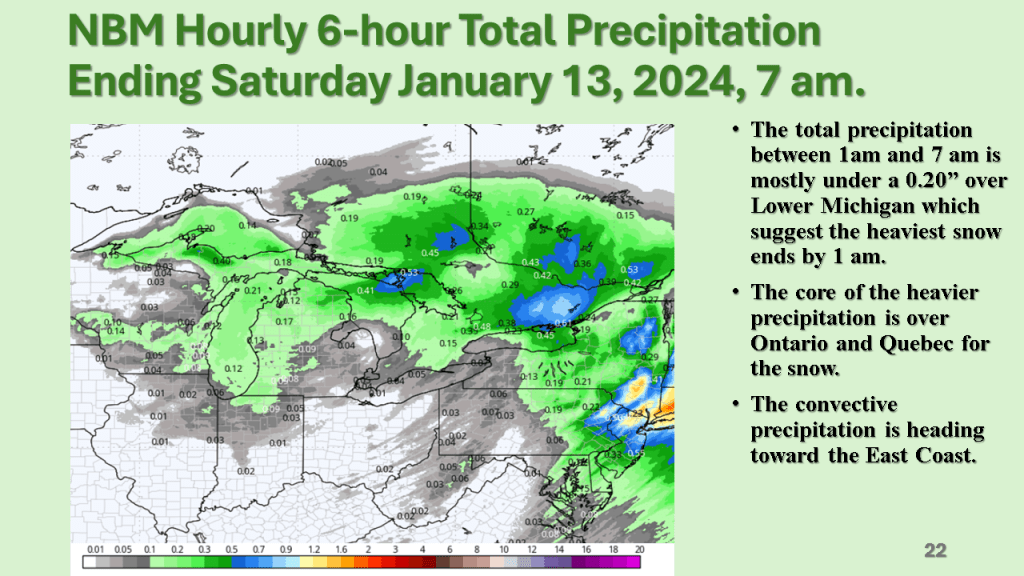


This storm brought heavy snow to the Midwest and parts of the Great Lakes, then there were damaging winds over the eastern Seaboard, as well as flooding. Severe storms and over a dozen tornadoes occurred over the Southeast sections.


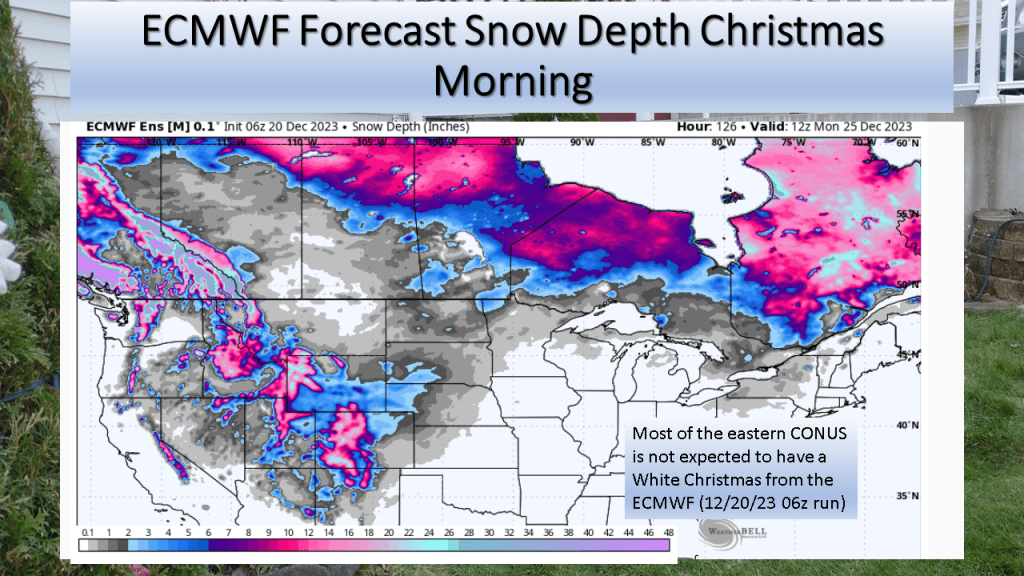
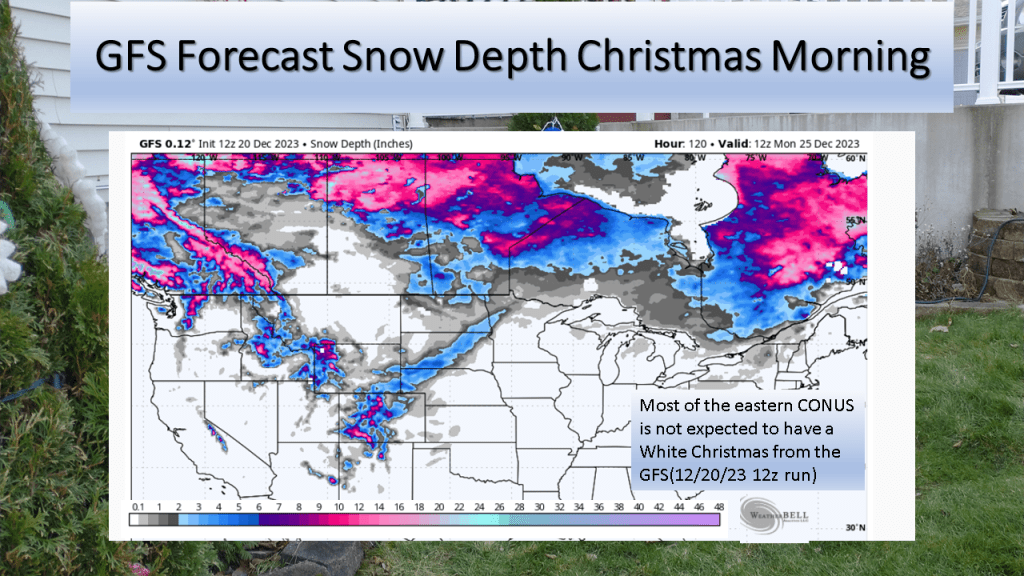
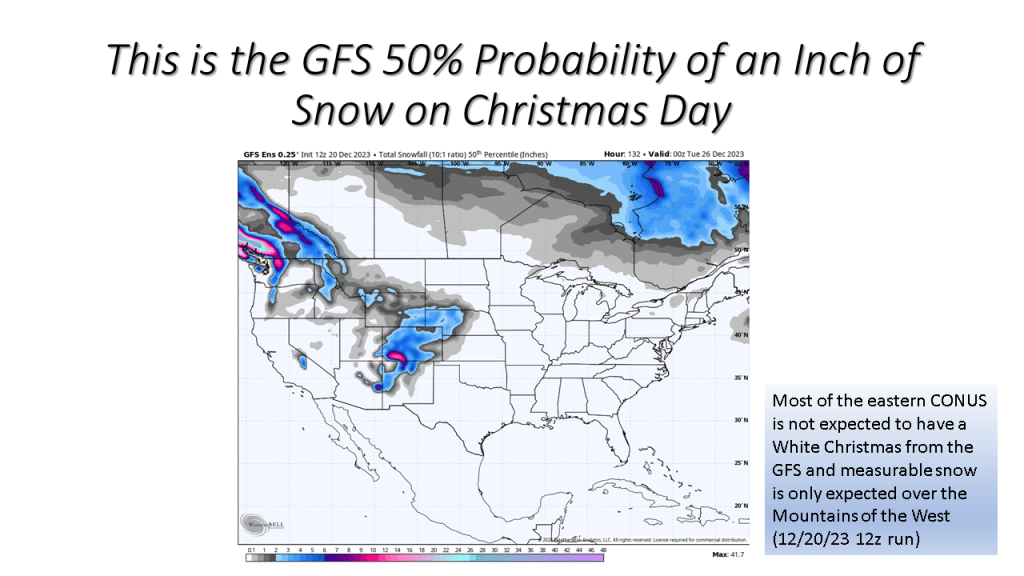
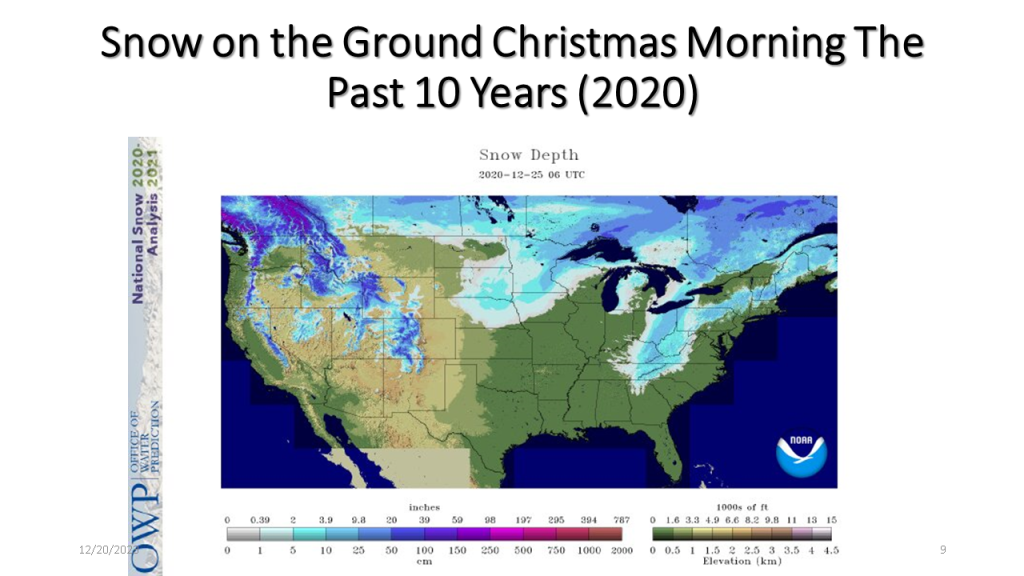
The short story is if you live in the central or eastern CONUS it is very unlikely you’ll have snow on the ground Christmas morning.
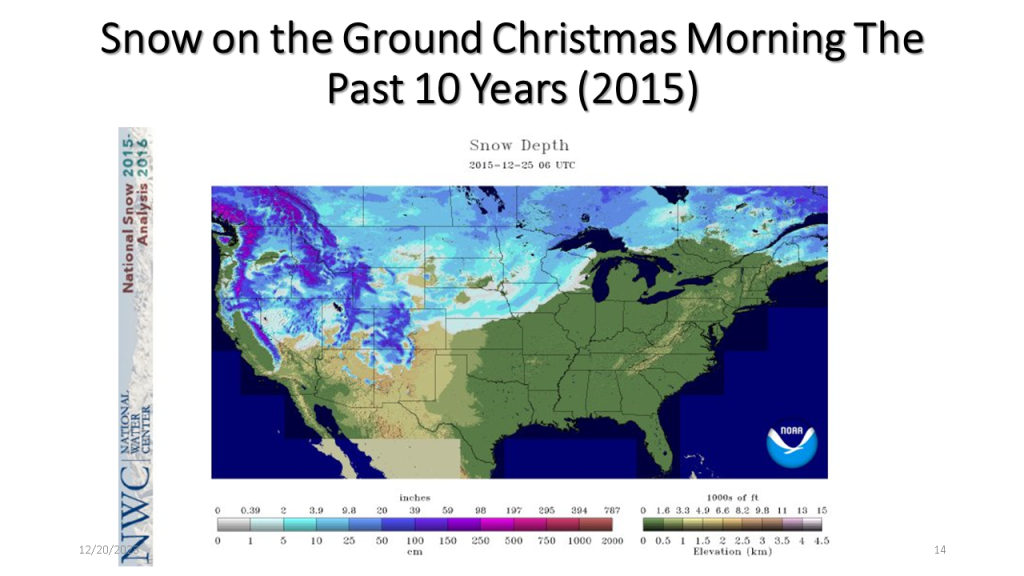
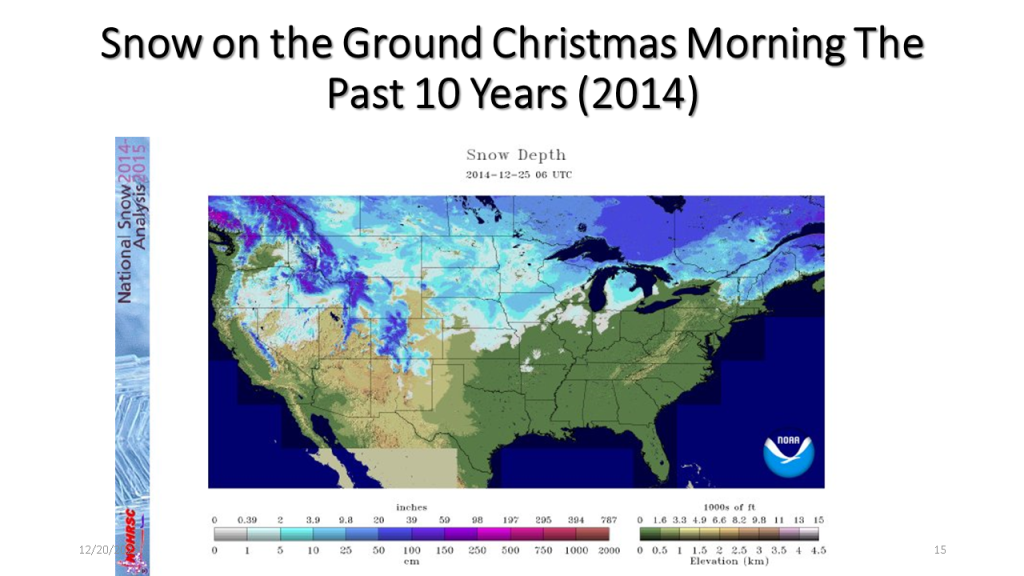
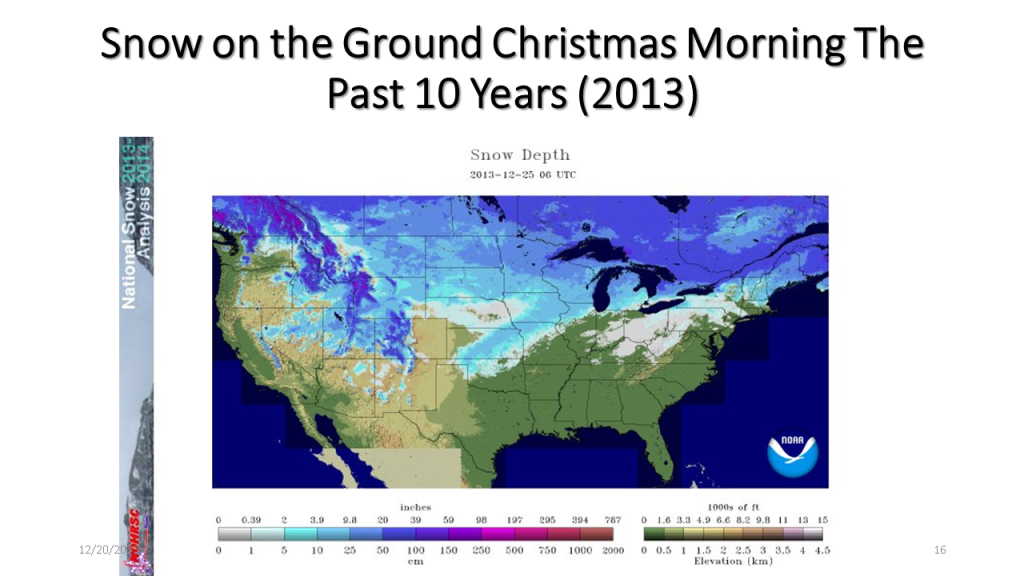
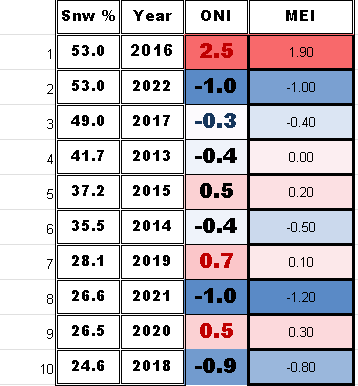
I have updated this to show the percent snow cover and ENSO state for each of the 10 years. At the end I have 2 tables that show the years with the ENSO index numbers and the snow cover for that Christmas. The bottom table sorts the percent snow cover from highest to lowest to see if there is a correlation between the ENSO state and the percent snow cover on Christmas day.


| Area Covered By Snow: | 53% |

| Area Covered By Snow: | 26.6% |
| Area Covered By Snow: | 26.5% |

| Area Covered By Snow: | 28.1% |

| Area Covered By Snow: | 24.6% |

| Area Covered By Snow: | 49.0% |

| Area Covered By Snow: | 44.1% |
| Area Covered By Snow: | 37.2% |
| Area Covered By Snow: | 35.5% |
| Area Covered By Snow: | 41.7% |
Below is a table showing the percent snow cover on Christmas
Below is a table showing the percent snow cover on Christmas Day in chronological order.
Below is a table showing ENSO numbers and the percent snow cover on Christmas day for that year sorted from the highest percent snow cover to the lowest. There does not seem to be a significant correlation to the ENSO state and the percent snow cover on Christmas Day.
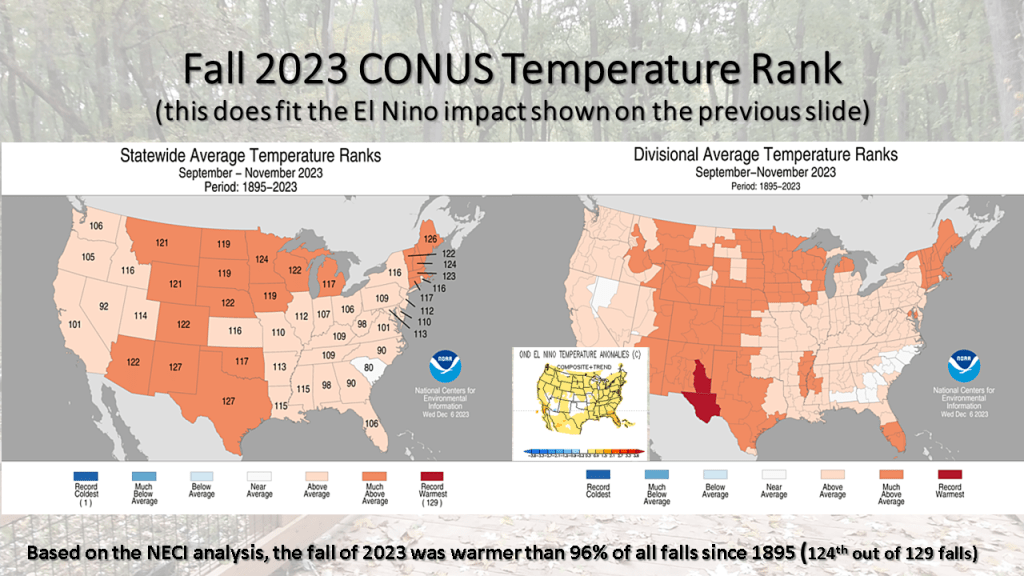
In our string of nationally much warmer than normal seasons, the fall of 2023 was 124th out of 129 falls for warmer than normal. This puts this fall warmer than 96% of all falls since 1895! No area of the CONUS had a below normal temperatures (bottom 1/3 coldest) this fall.