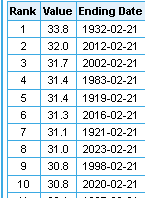
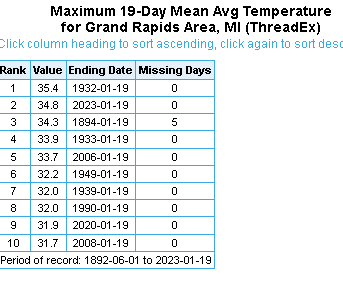
Based on the information below I would suggest we have already started an early spring weather pattern. Based on the chart below, this has been to date, the 8th warmest winter on record in Grand Rapids, with only 7 more days remaining February, this will not change significantly.
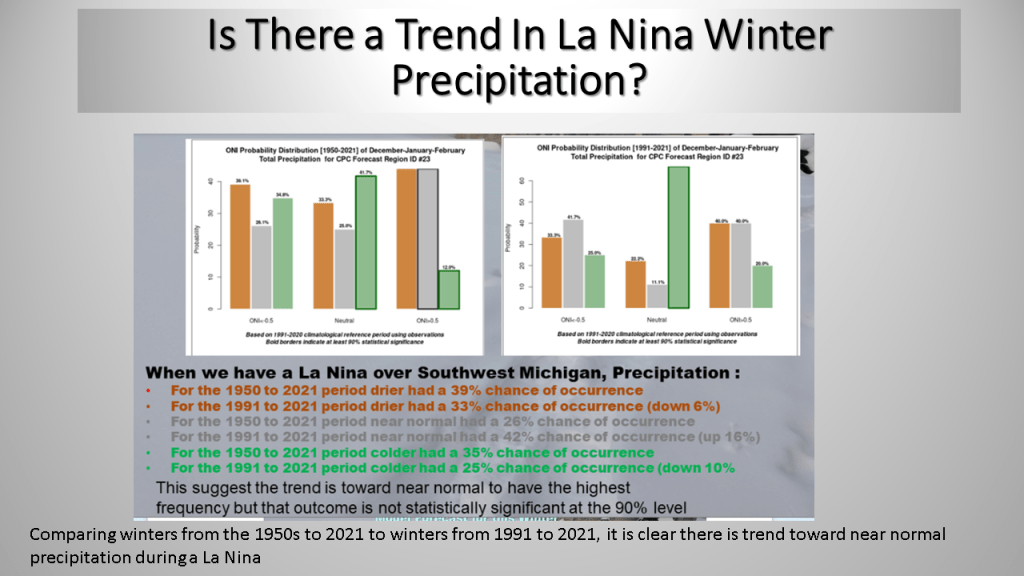
I want to point out that I am not saying we will not get more snow, or even a period of cold weather, what I am saying it warmer than normal period will be longer than colder than normal periods and any snow we do get will melt within a few days.
One of the nice things about this format is, unlike when I use to write forecast discussions from the National Weather Service, I can add images now!
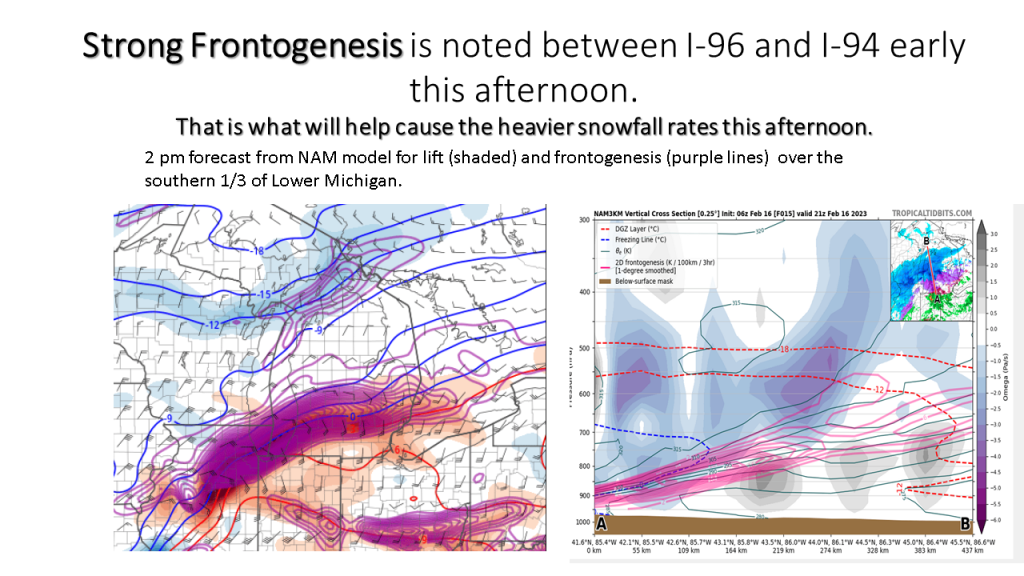
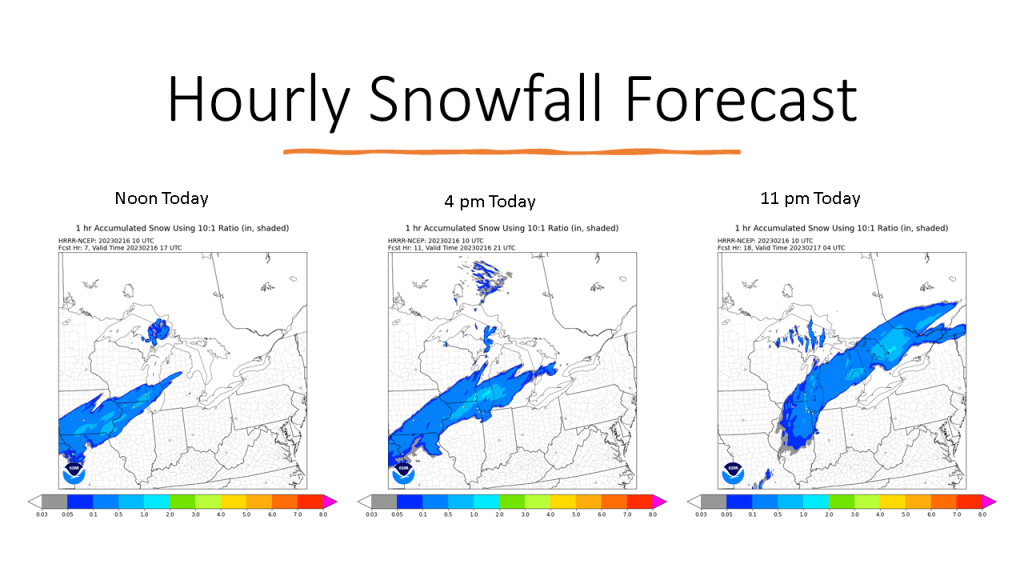
I am expecting any mixed precipitation that develops this morning over our area to change to snow by afternoon. It will become windy this afternoon and temperatures are expected to fall into the 20s to mid to late afternoon. This will lead to slippy travel over most of our area during the afternoon and evening. The snow should end shortly after midnight.
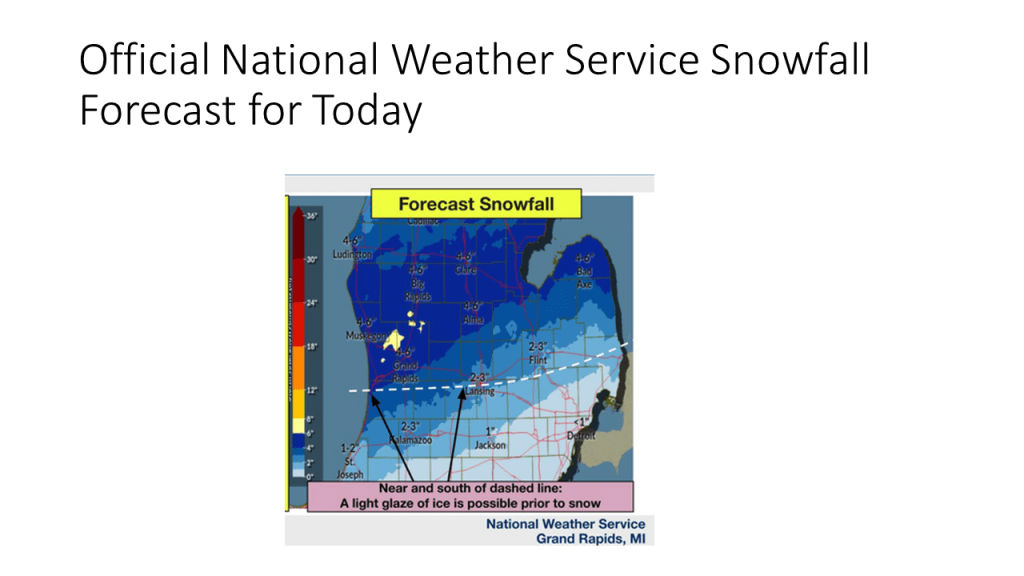
The heaviest snowfall amounts of 5 to 8 inches will be north of I-96 but south of route 10. The I-96 areas is expected to get between 2 and 4 inches by this evening.
This image is thanks to the Grand Rapids National Weather Service
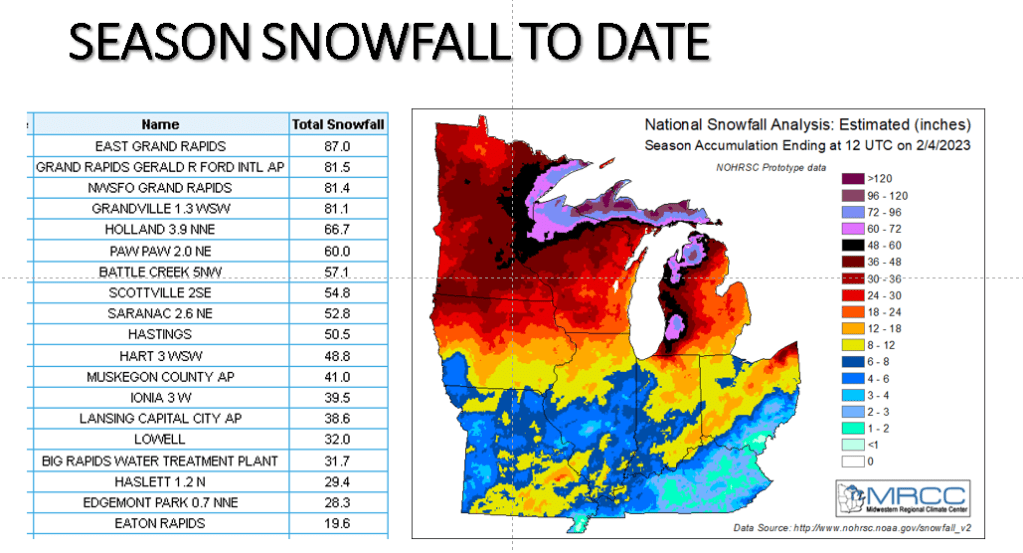
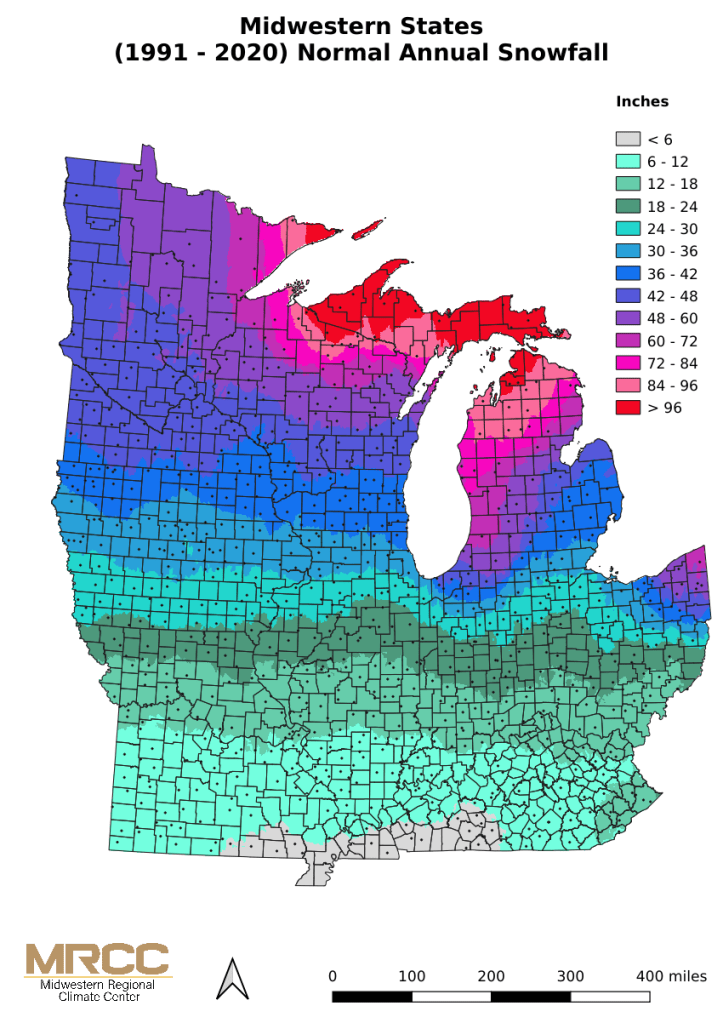
Note the heaviest snowfall this winter has been displaced inland toward US-131 compared to the typical heaviest snowfall near the lake shore (see map below). What is odd too, is my Grandville weather station has less total snowfall than the official site at Grand Rapids. I do not remember a year, since I moved here in 1995 where that was true like it is this winter.
This is the normal seasonal snowfall across the area.
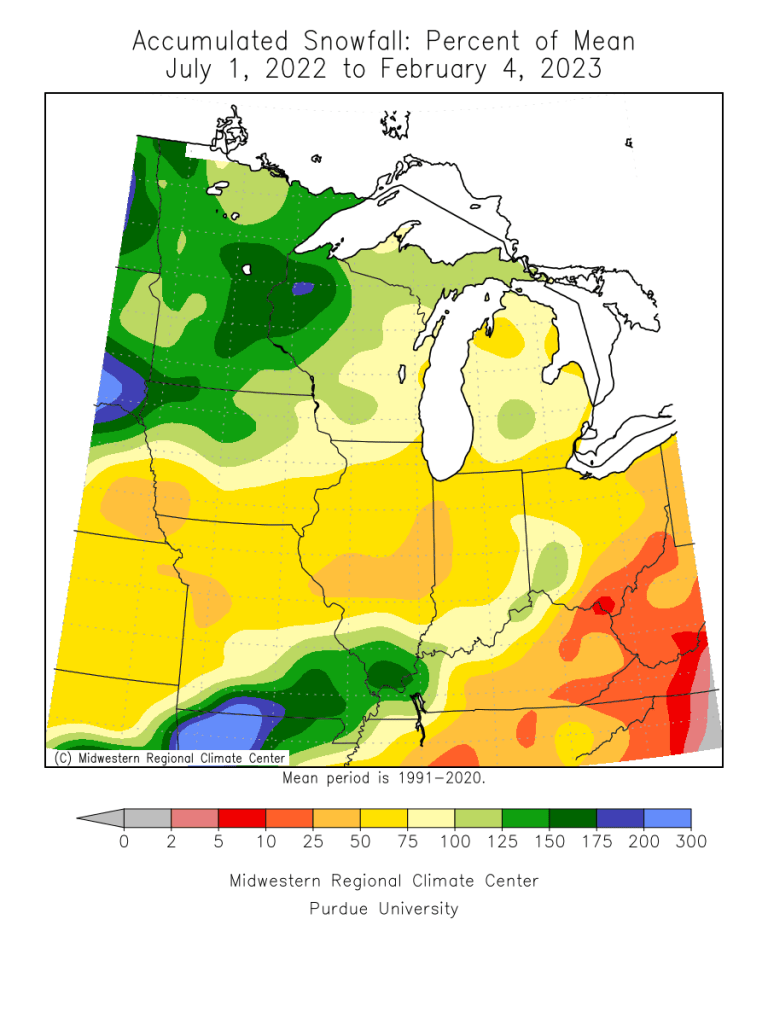
The percent of the mean shows this too, that is the heavier snowfall, relative to normal has been displaced inland for this winter season.
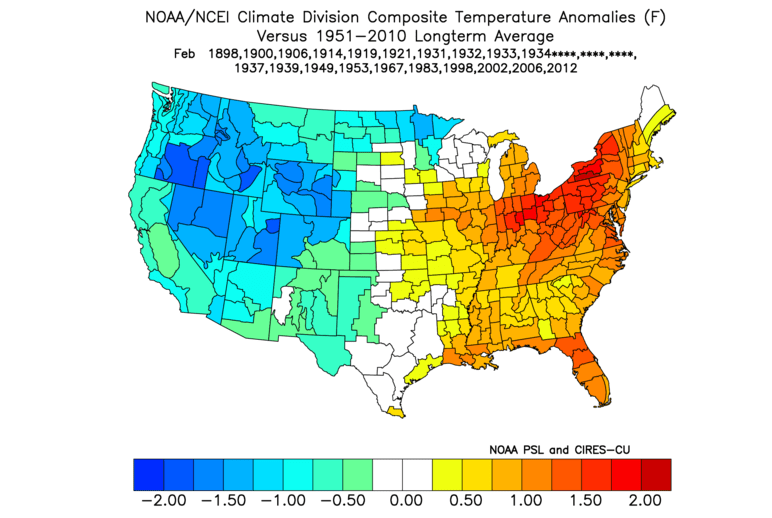
This map above is what typically happens in February when January at Grand Rapids had a very high frequency of above normal temperature days. This suggest we will be near the storm track and that warmer than normal temperatures appear more likely than below normal temperatures for Southwest Michigan.
What I did to figure this out was to look at all the daily departures from normal in the January’s in the Grand Rapids climate data base. For each January I counted the number of days with the daily departure from normal being positive. This used the NCEI normal for that decade. As it turns out, of those January’s with the frequency of being warm than normal was in the top 1/3 highest, 24 years, only 3 years 1900, 1914, and 1934 had a February with the departure from normal frequency in the top 1/3 coldest.
Based on just this idea, it would seem February in Grand Rapids will more likely end up with a higher frequency of above normal temperature days than below normal temperature days. More more point, there is a strong correlation for high frequencies of above normal temperature days in a calendar month and warmer than normal month.
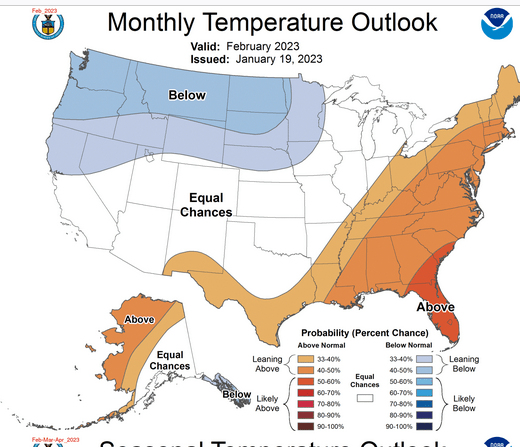
Now let us look at the latest CPC forecast data to see if there is any chance this could really turn out this way.
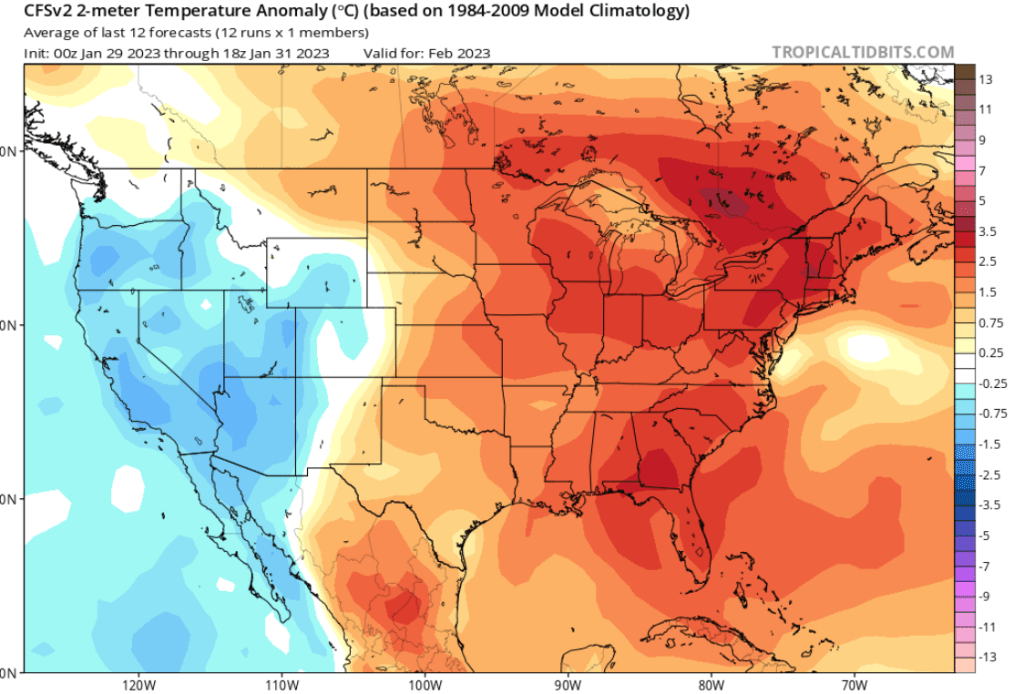
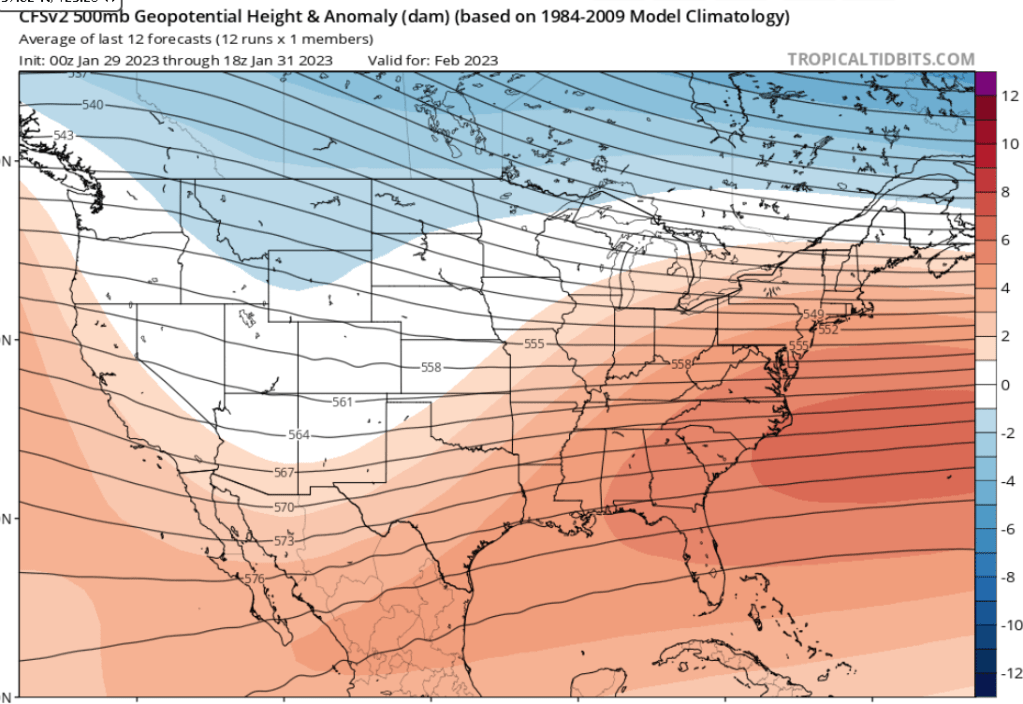
The CFSv2 forecast for February (the last one CPC issued) surely looks like my forecast map above. Note how the warmer than normal is over the eastern and central CONUS and colder than normal is over the western states. I do admit there is a larger area of warmer than normal on this forecast map than on my forecast map.
The above map is CFSv2 temperature anomaly forecast for February 2023 from the 18z run on the 31st of January.
This is the 500 Mb forecast height anomalies for February
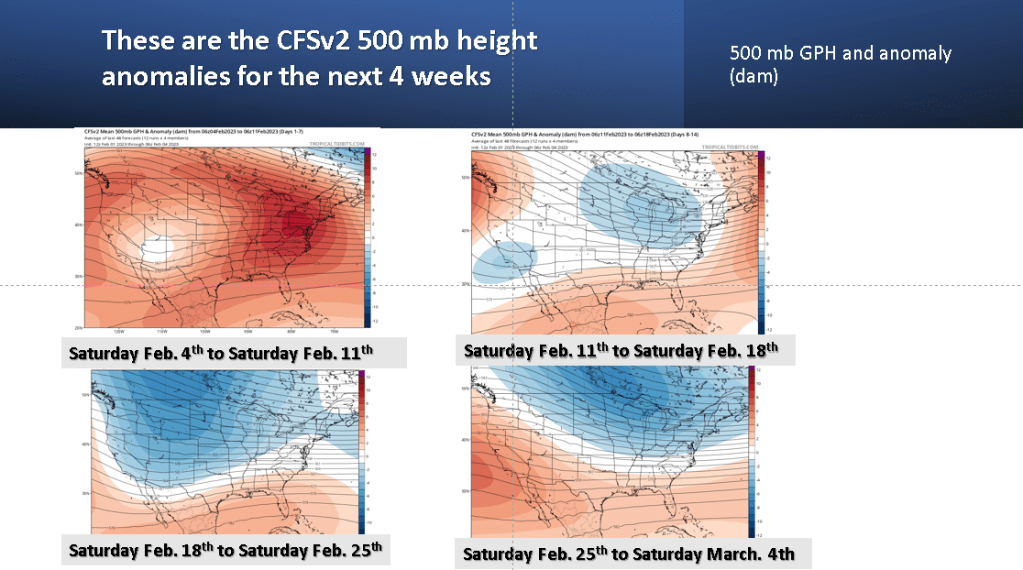
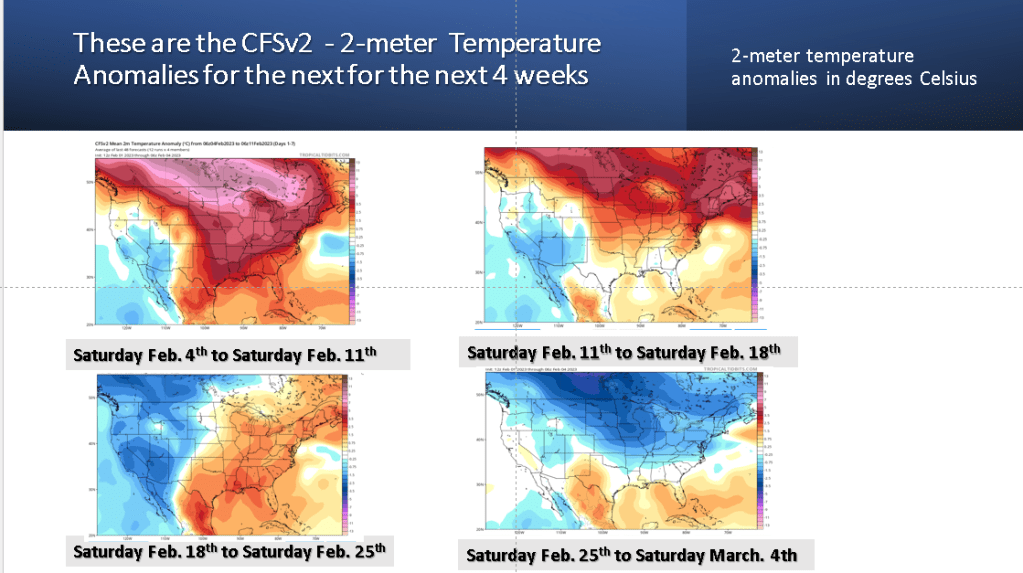
Now lets look at the very latest (Feb. 4th) CFSv2 latest weekly forecast. First we will look at the upper level height forecast. This suggests we have an upper level ridge this coming week, which will keep us warm. However for the rest of the month it would seem and upper trough develops and persists into March. This would mean cold will win by the end of the month.
This developing upper trough does not really bring us cold weather until the end of the month. Looking at the next four weeks, it would seem my forecast, based on the frequency of above normal temperature days at Grand Rapids may have predictive value across the CONUS!
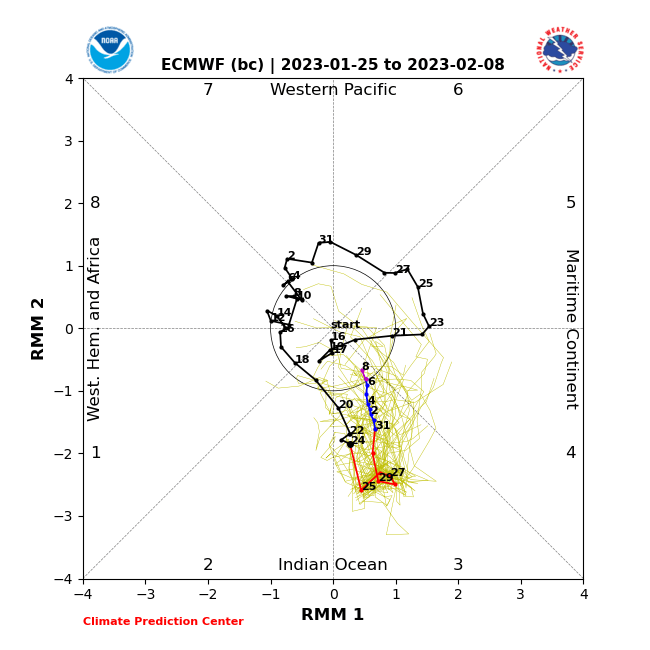
Does the MJO support this idea?, I do believe it does. The forecast below is from the ECMWF (which tends to do better than the GFS version of MJO), in this case through they are similar.
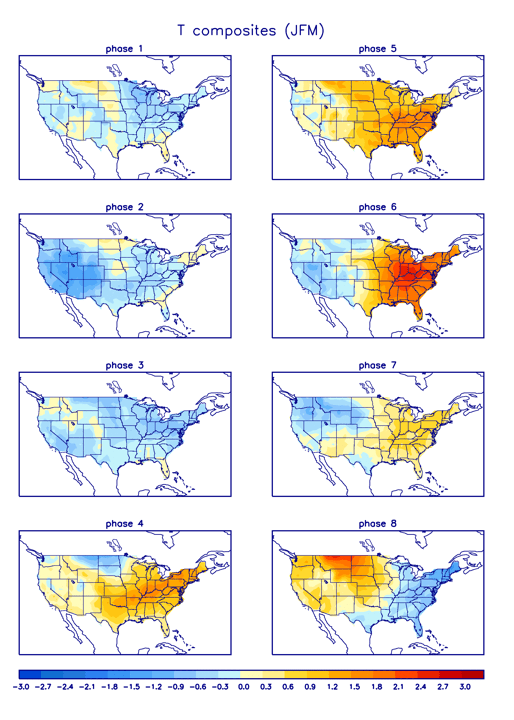
Phase 3 is cold for SW Michigan but phases 4 through 7 are warm for Michigan in February. We do not see the MJO going into phase 8 , which is cold for SW Michigan until the end of the month. This will be fun to watch and see how this plays out!
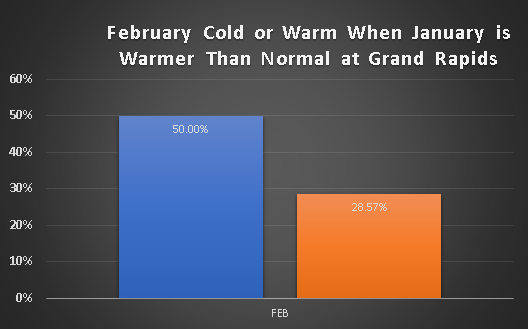
Looking at Grand Rapids temperature data back to 1892, and then sorting all Januaries that were in the top 1/3 warmest it should be noted that February turned out to be colder than normal (bottom 1/3 coldest) 50% of the time. I t was warmer than normal only 28.6% of those years. It should be noted that this frequency of cold verse warm February months, when January was warmer than normal has not changed much over time, that is the rate of cold /warm February outcomes has stayed about the same, even recently.
So what am I thinking will likely be the outcome this February? I am favoring a cold first week of February, which is strongly supported by just about all of the model guidance . What happens after that is a good question. The MJO becomes to weak to drive the Northern Hemisphere circulation by the second week in February. However, given how our weather this past fall and winter continues to go back and forth between cold and warm, I am thinking it will warm up mid to late February. I am favoring the CPC forecast actually. This shows equal chance, however I am thinking we will average near normal, which is what happened at Grand Rapids for Oct. , Nov. and Dec.
Looking at the forecast from the CFSv2 (CPC climate model) the first week of February looks to be colder than normal. (map from Tropical Tidbits).
The MJO forecast via the ECMWF suggests phase 3, which is cold for Michigan in February. That is shown by CPC temperature composites for the MJO which is below. Note we are already in Phase 3, but the MJO is forecast to weaken as we go through the first week of February. So the question becomes will it stay cold?
The map above shows the most likely temperature anomaly for a given phase of the MJO for the CONUS for January-March.
It does look like we will have a wintry start of February over Southwest Lower Michigan.