


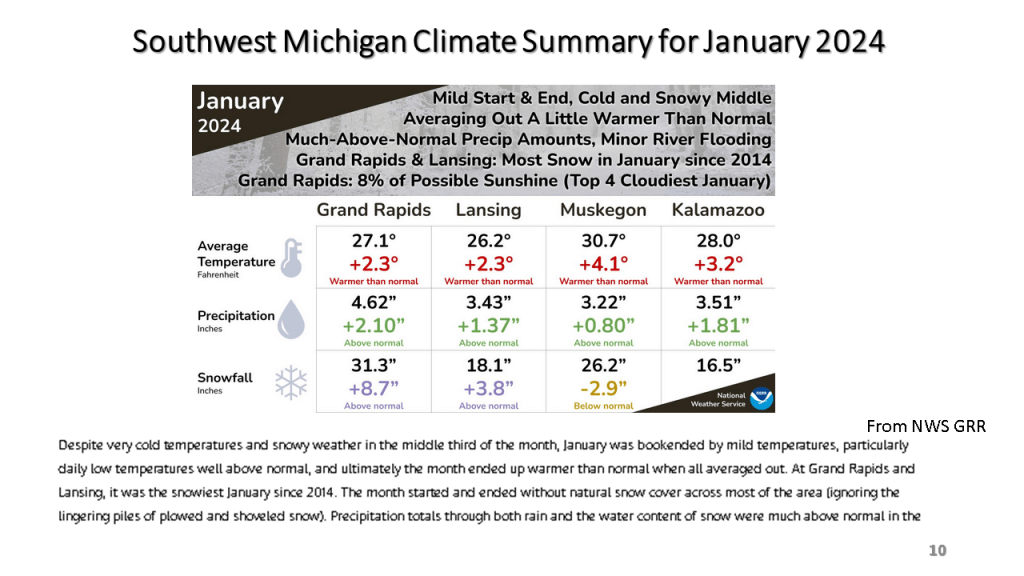
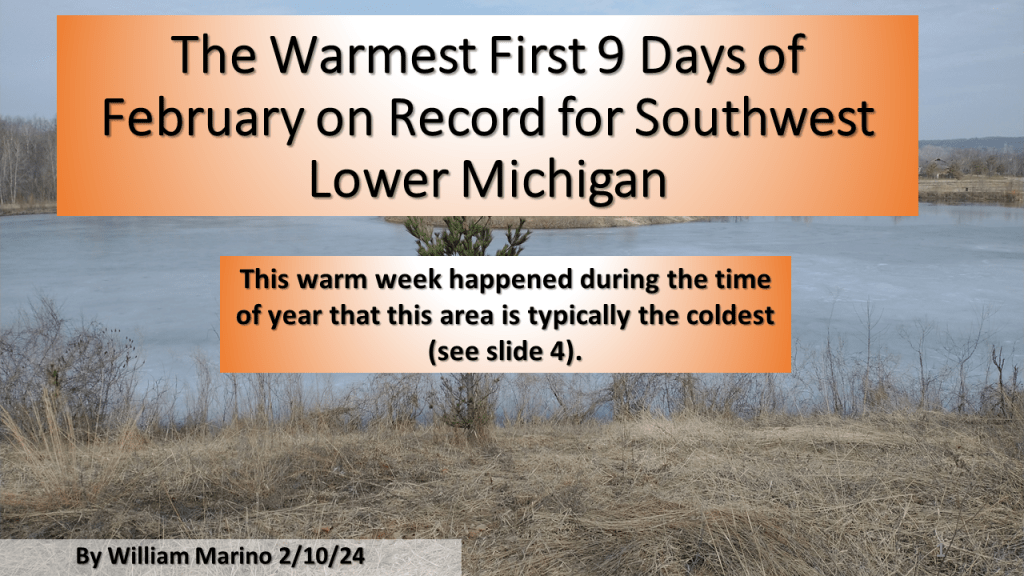
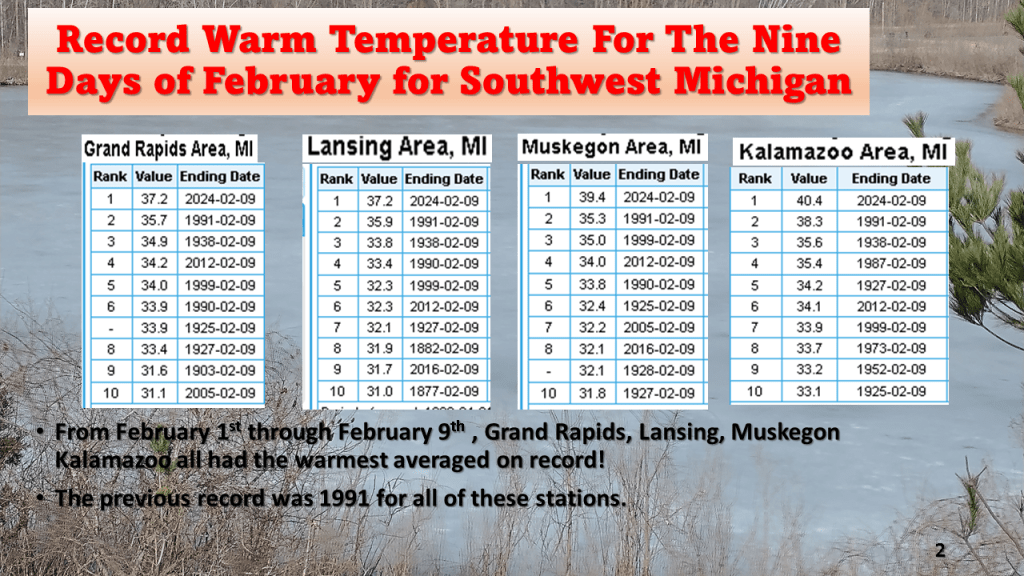
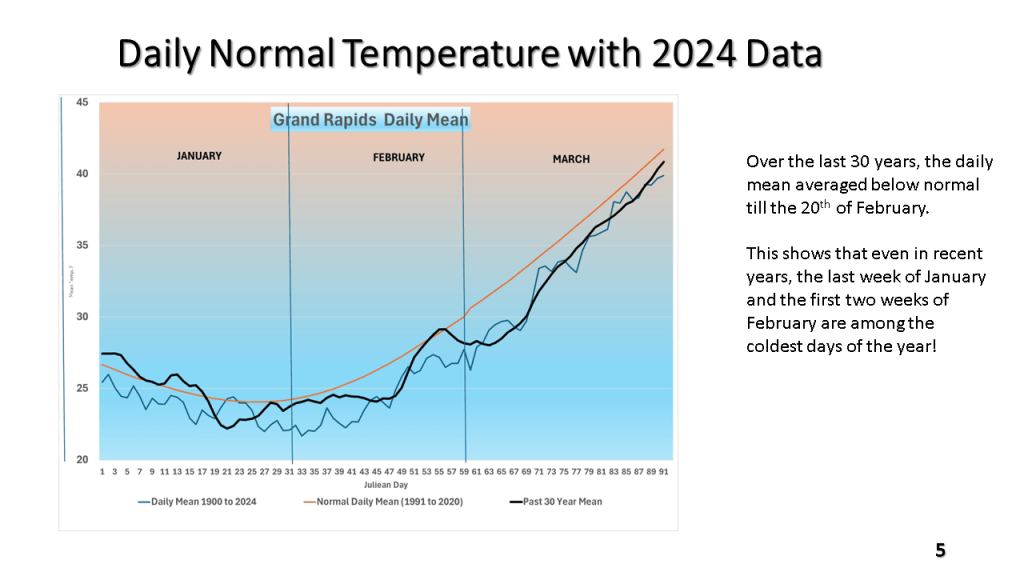
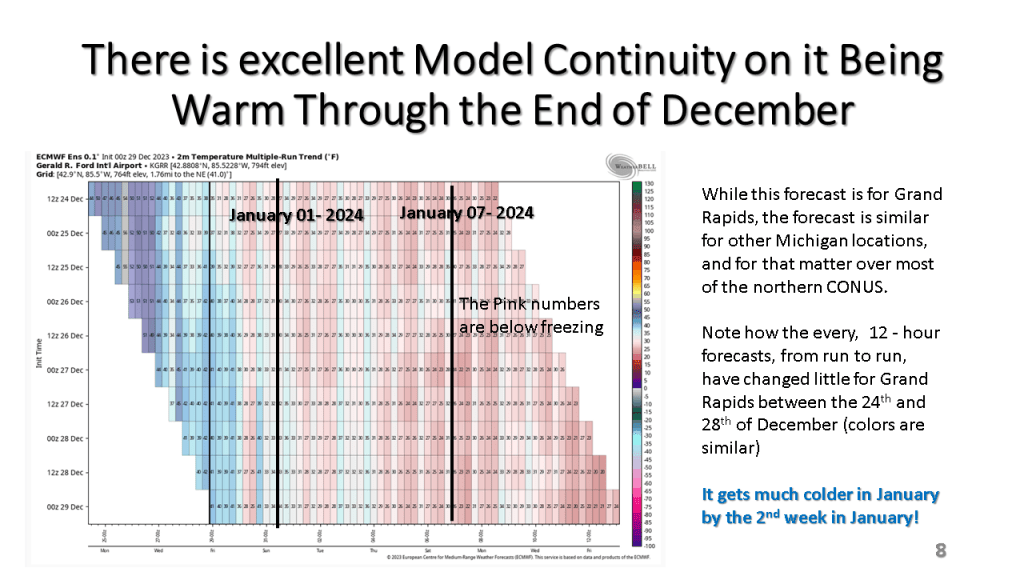
What makes this more striking is that over the past 30 years, the last week of January and the first two weeks of February are the coldest weeks of the entire year. The mean of 37.2 degrees in Grand Rapids would be normal for the 20th of March (using the 1991-2020 normal).
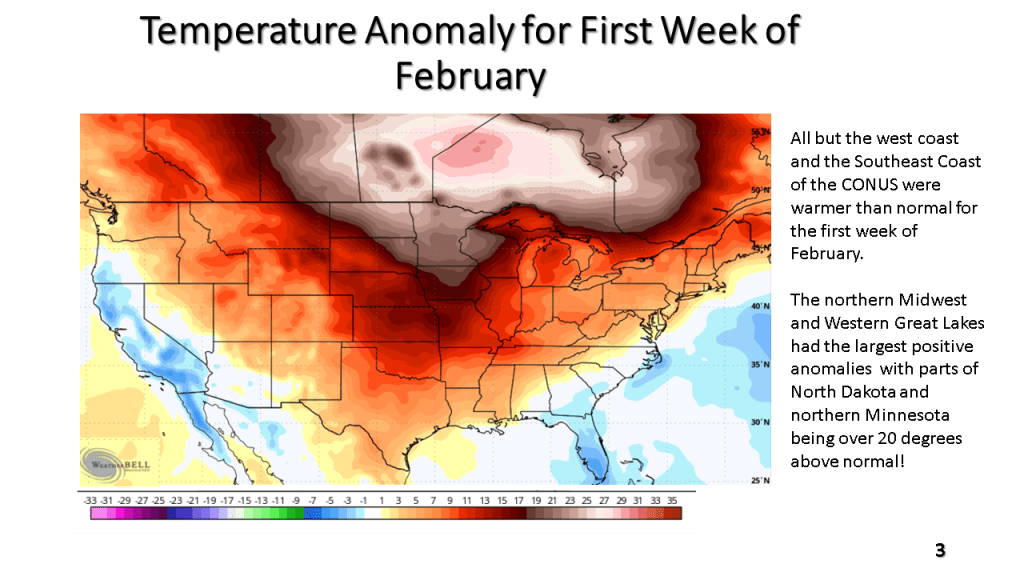


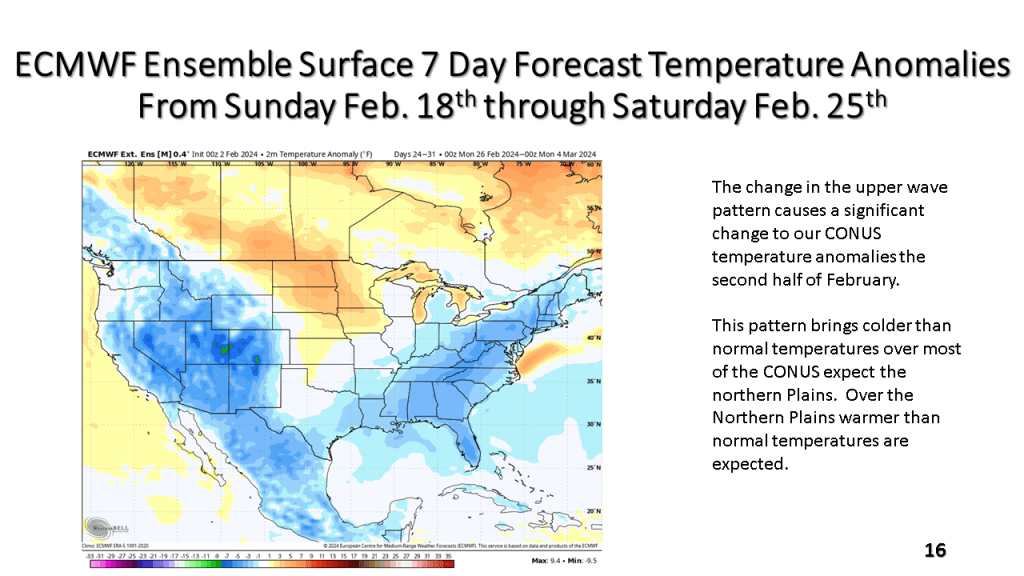


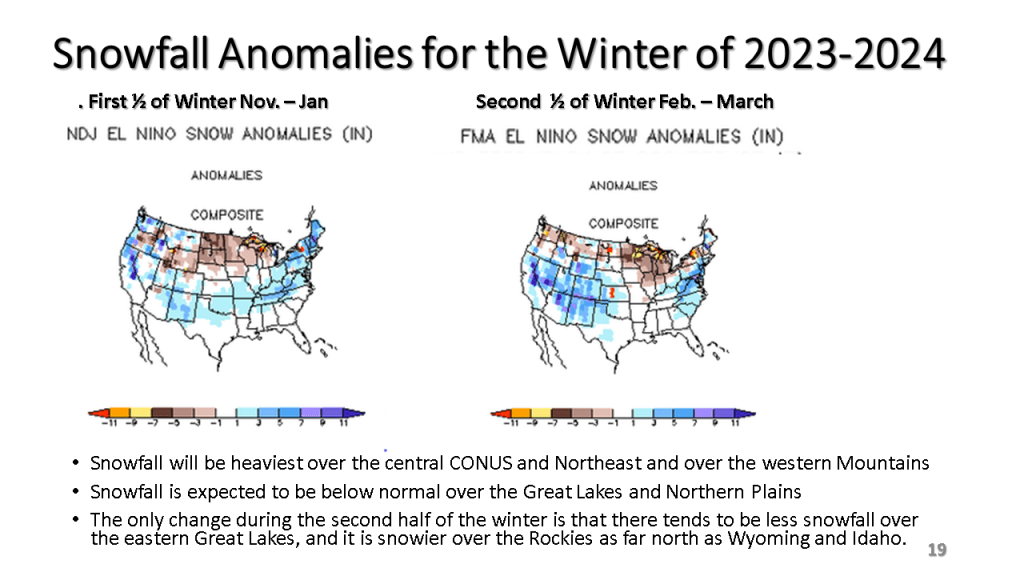
The bottom line is it will be very warm, relative to normal until around Valentine’s Day, the it will get cold across most of the central and eastern CONUS with a significant amount of snow over the Great Lakes and New England.
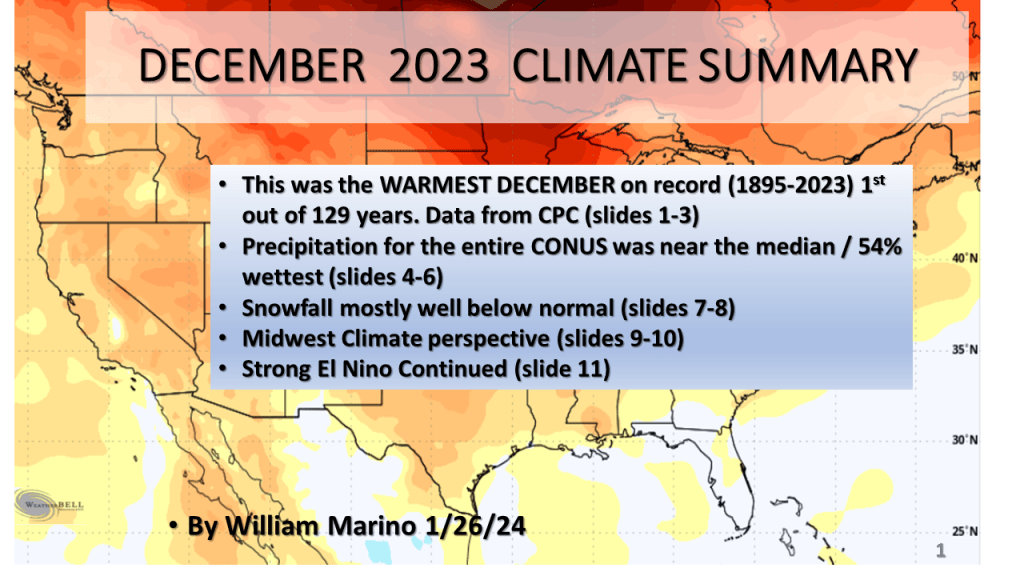
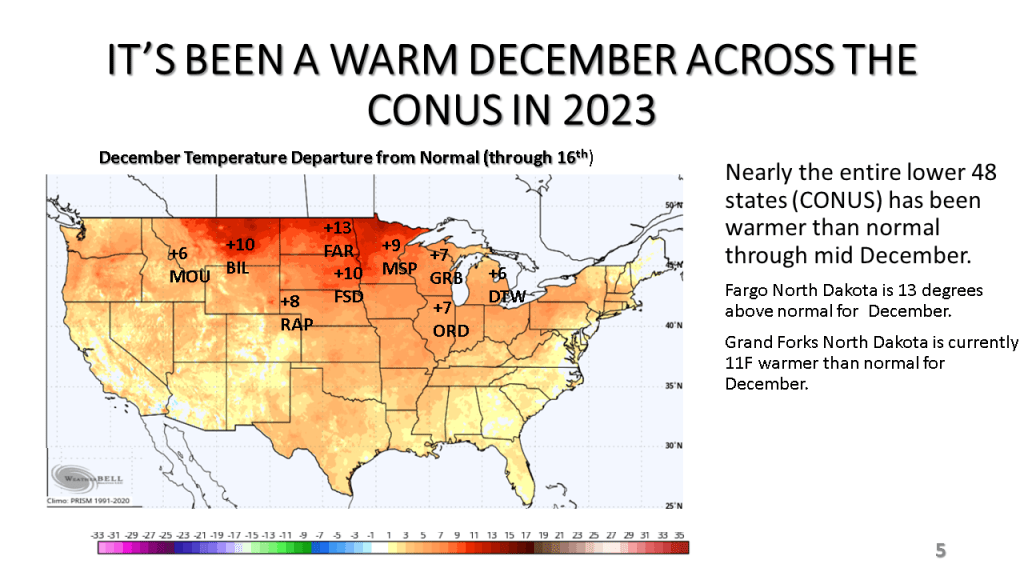
Record warmest December for the CONUS (1st out 129 years)
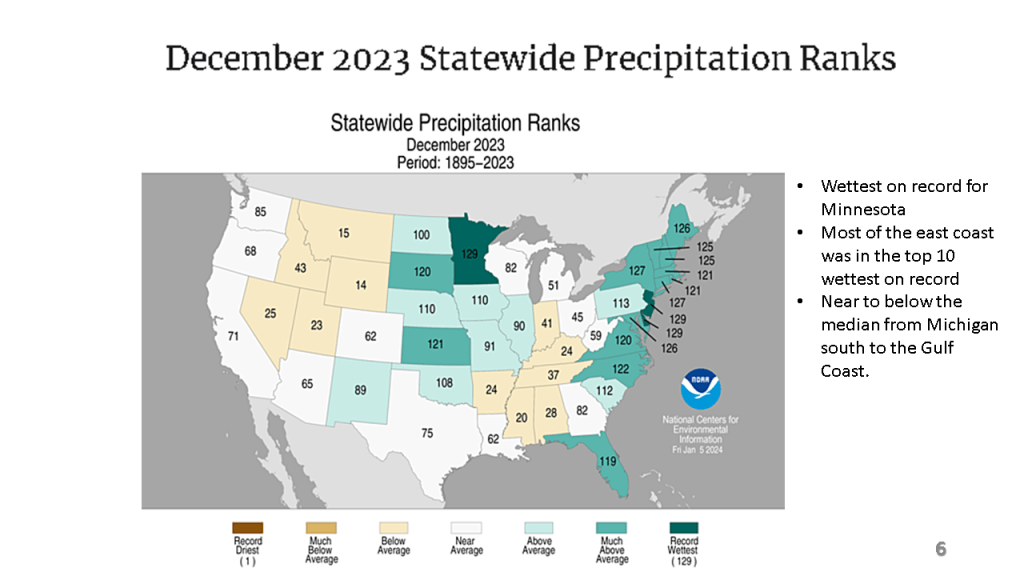
Precipitation was near normal (70th out of 129 years)
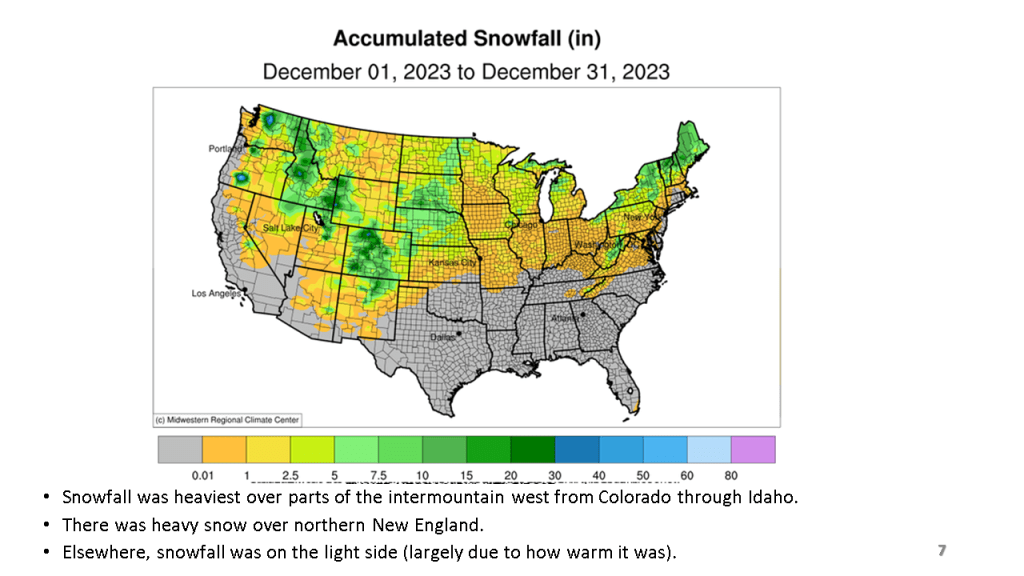
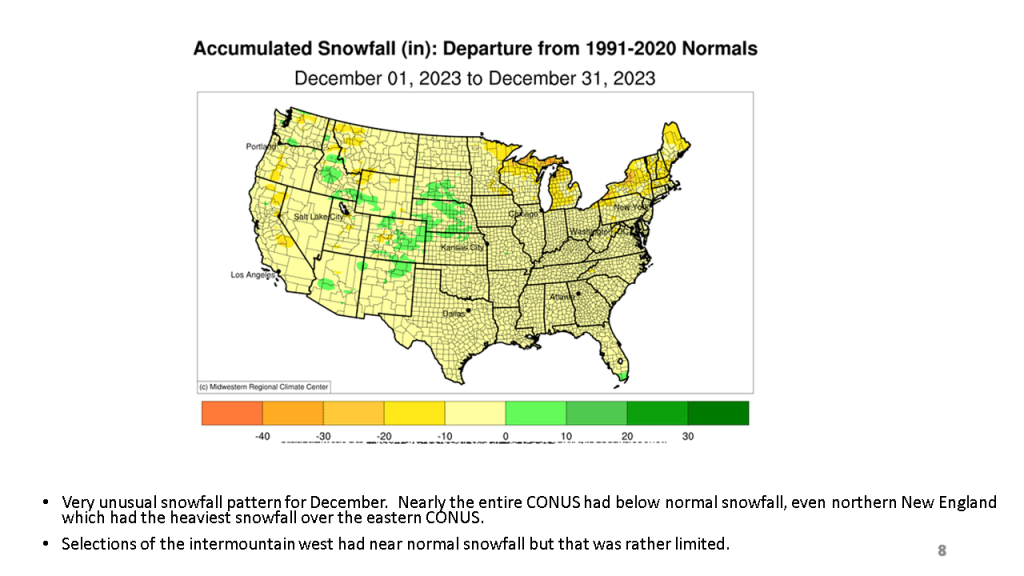
Snowfall was well below normal across the CONUS
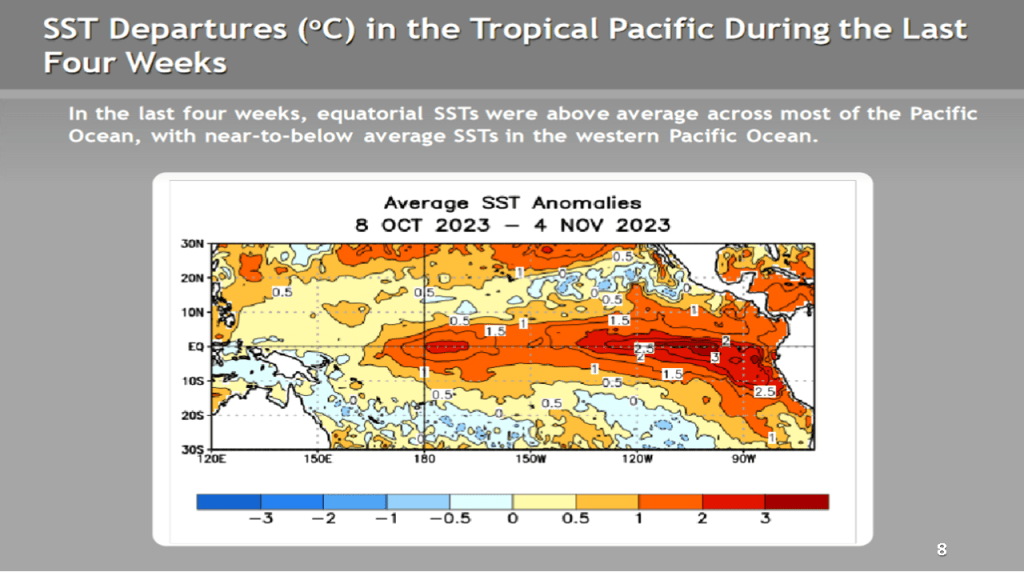
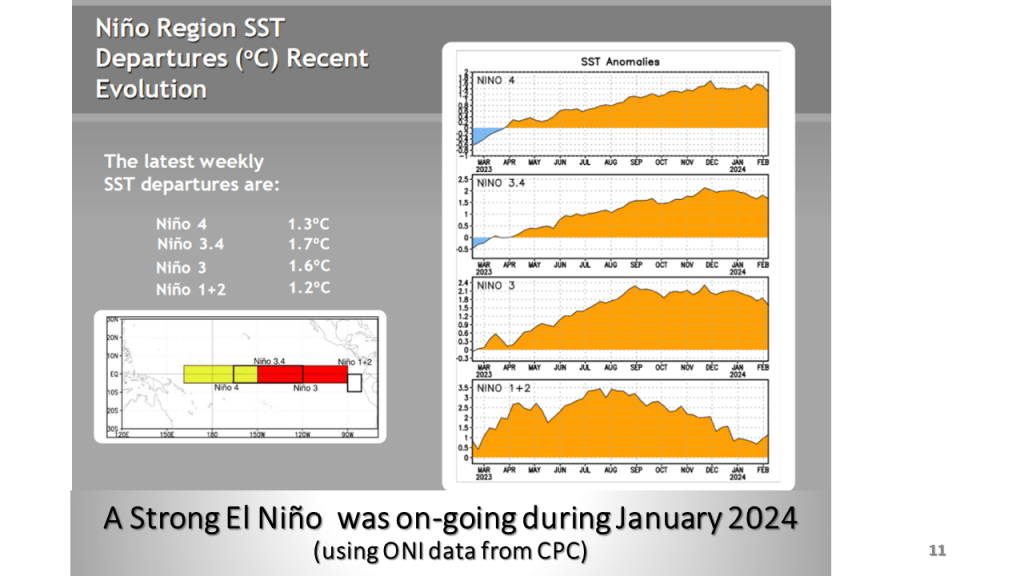
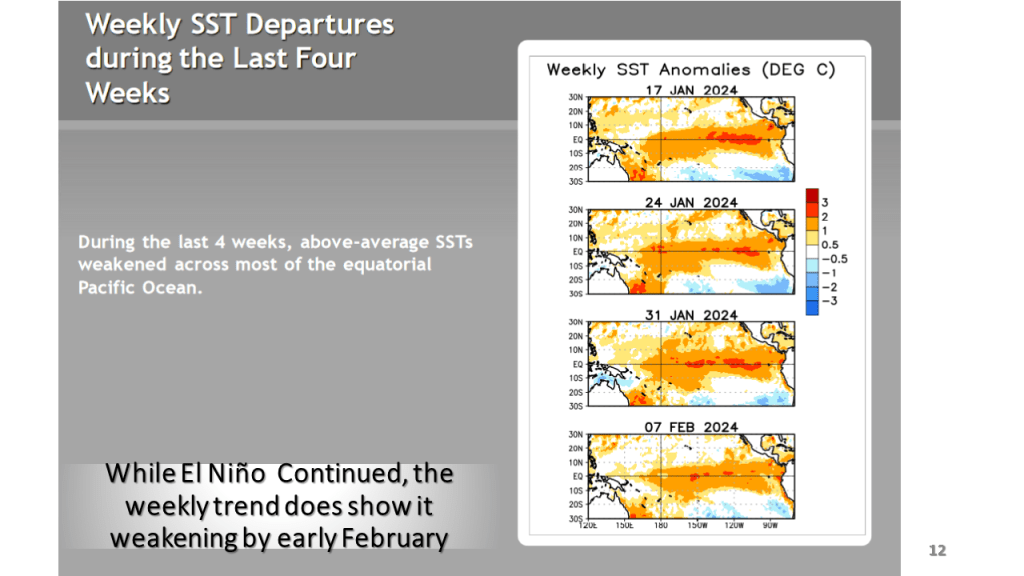
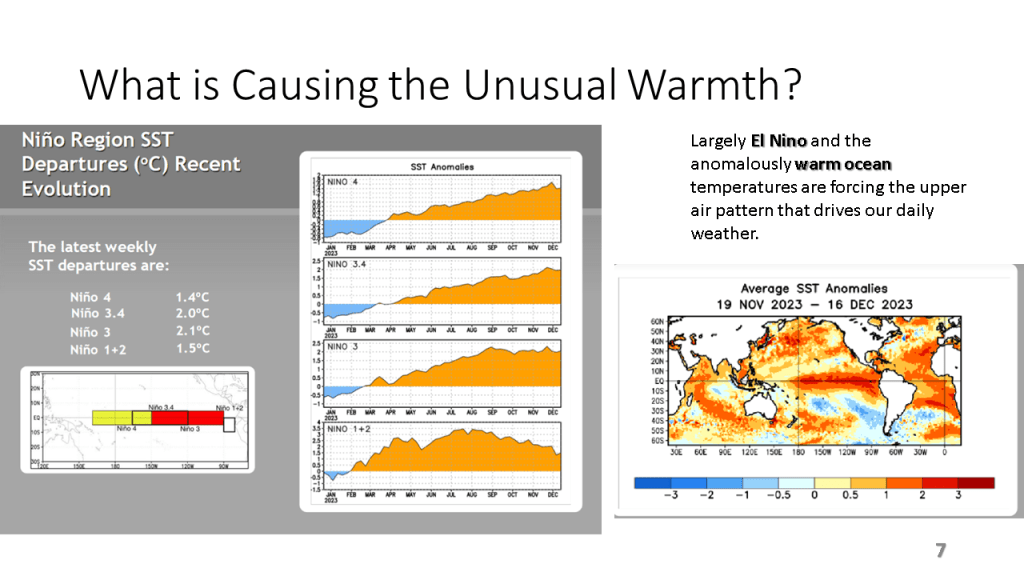
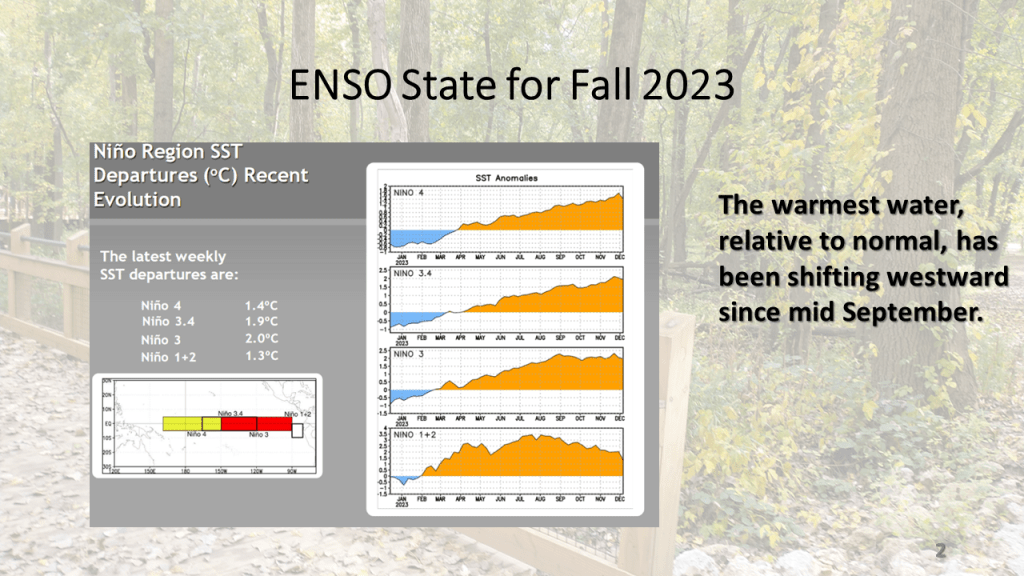
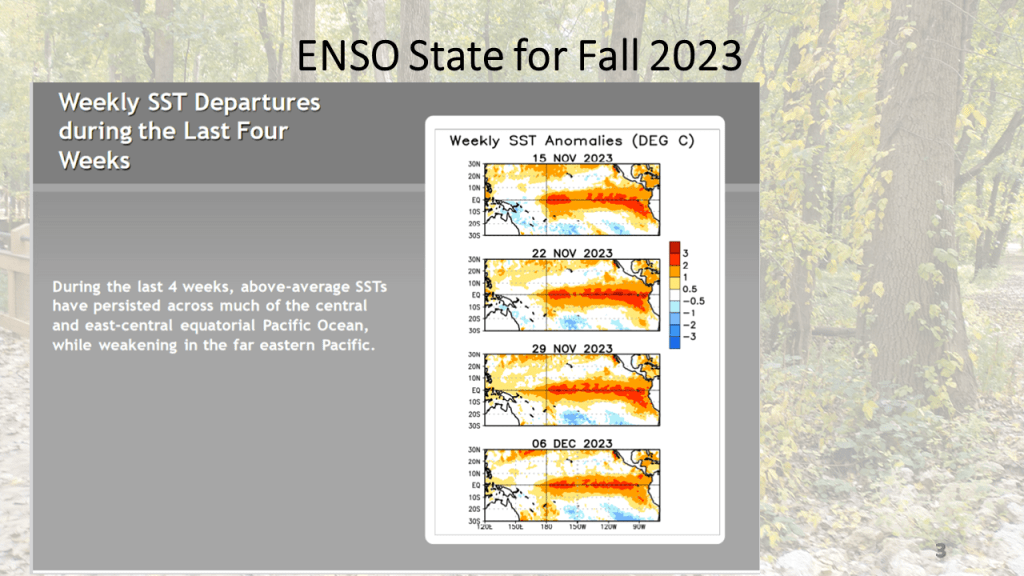
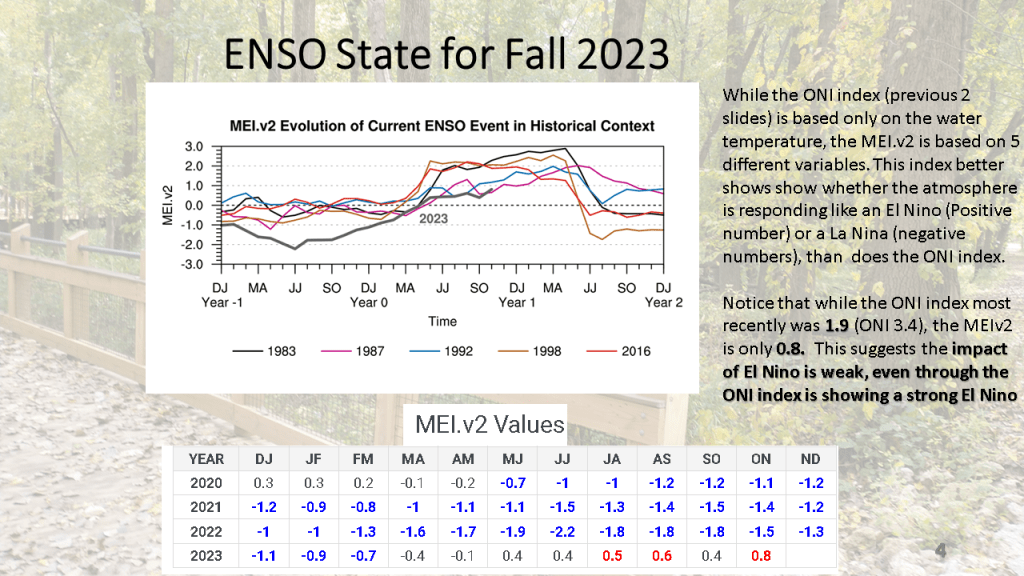
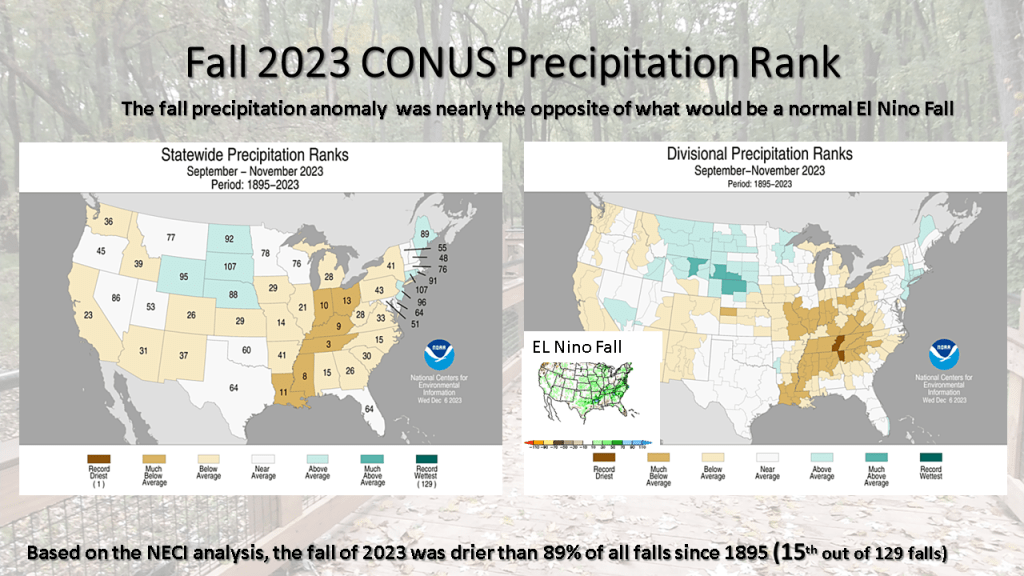
A strong El Nino Continued (based on ONI data from CPC)


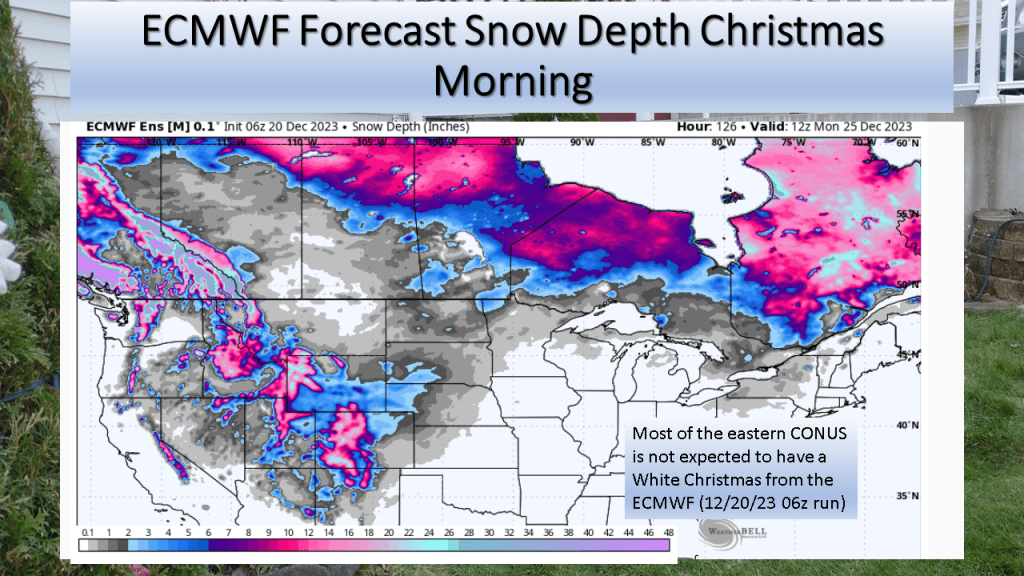
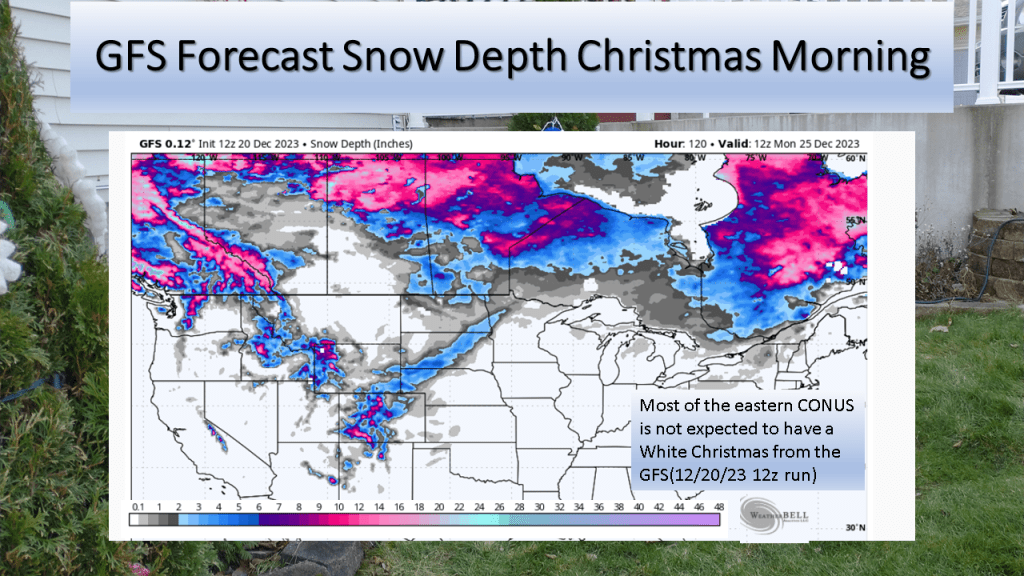
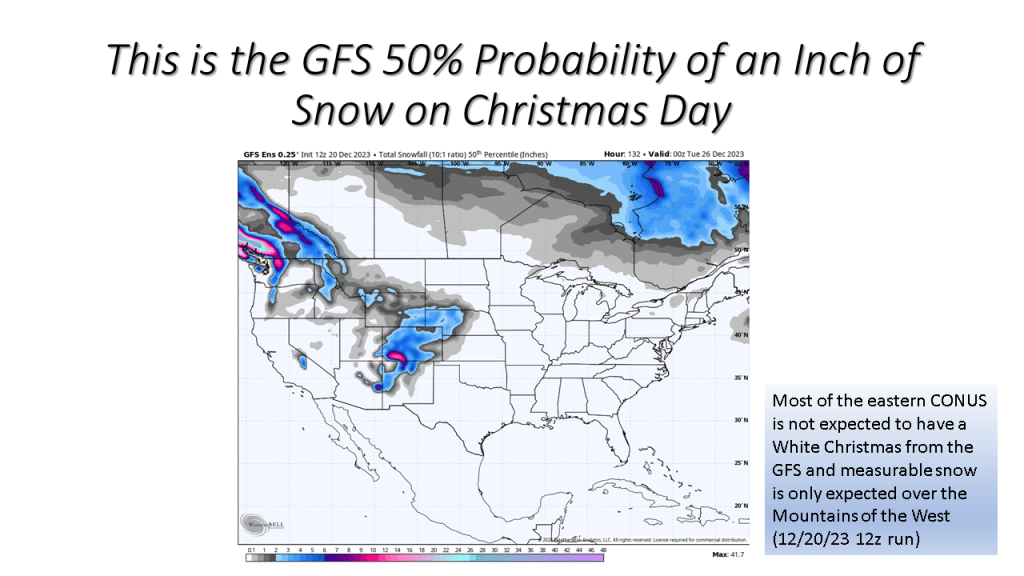
The short story is if you live in the central or eastern CONUS it is very unlikely you’ll have snow on the ground Christmas morning.
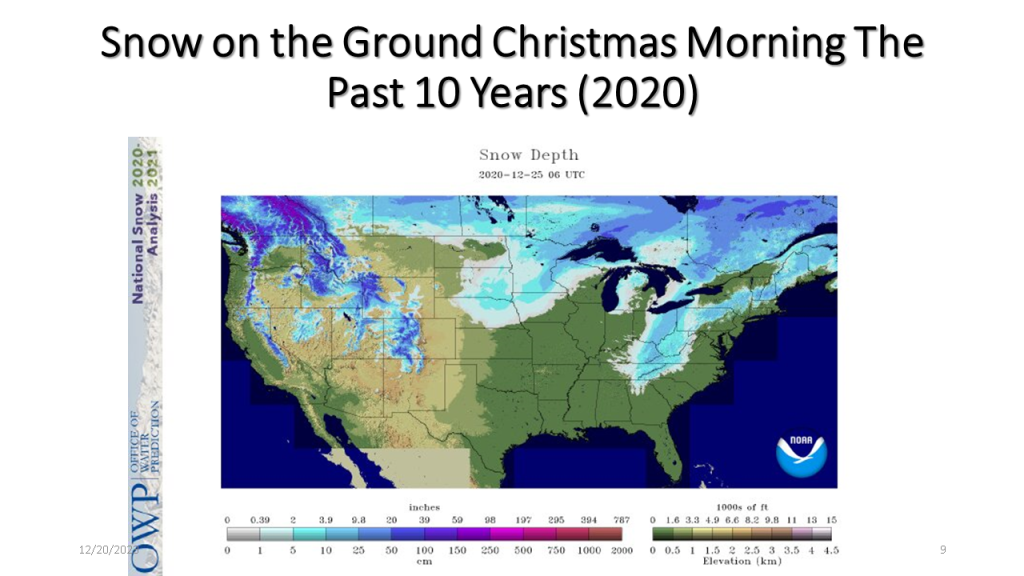
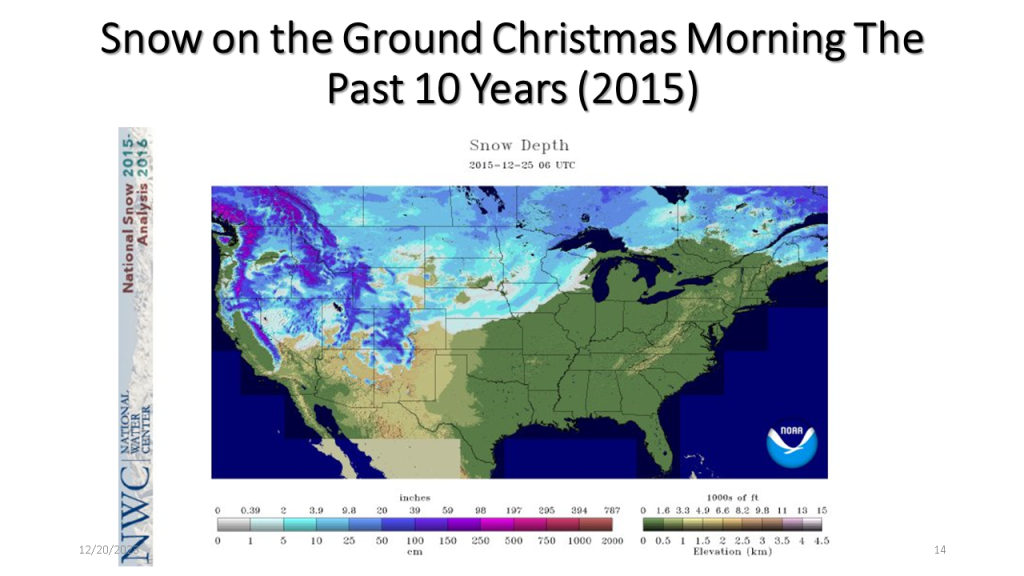
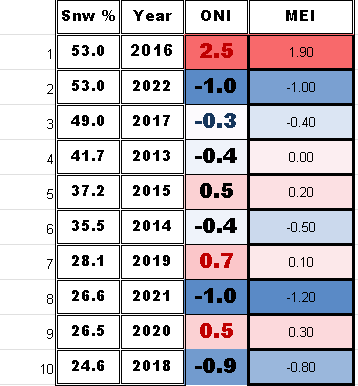
I have updated this to show the percent snow cover and ENSO state for each of the 10 years. At the end I have 2 tables that show the years with the ENSO index numbers and the snow cover for that Christmas. The bottom table sorts the percent snow cover from highest to lowest to see if there is a correlation between the ENSO state and the percent snow cover on Christmas day.


| Area Covered By Snow: | 53% |

| Area Covered By Snow: | 26.6% |
| Area Covered By Snow: | 26.5% |

| Area Covered By Snow: | 28.1% |

| Area Covered By Snow: | 24.6% |

| Area Covered By Snow: | 49.0% |

| Area Covered By Snow: | 44.1% |
| Area Covered By Snow: | 37.2% |
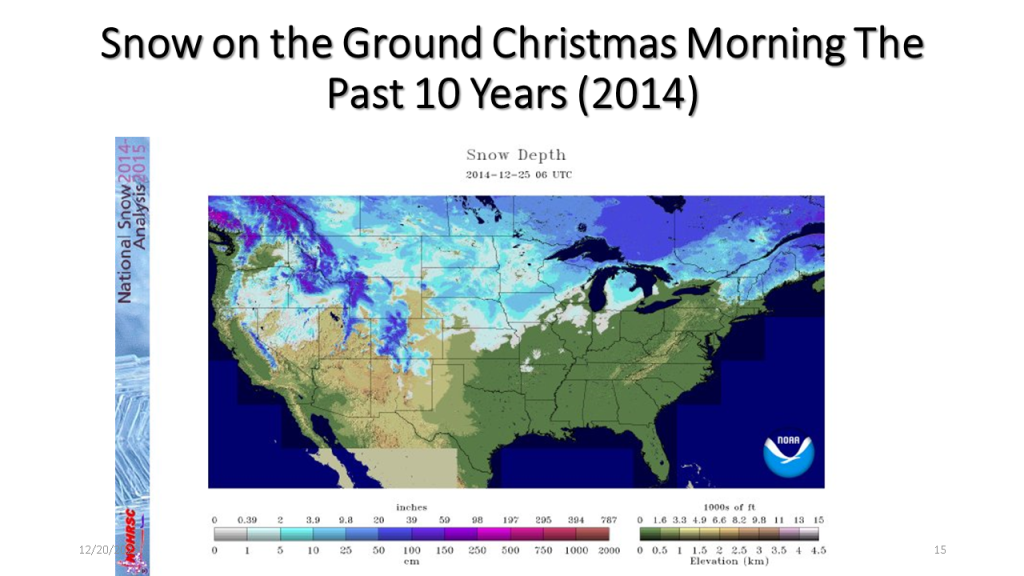
| Area Covered By Snow: | 35.5% |
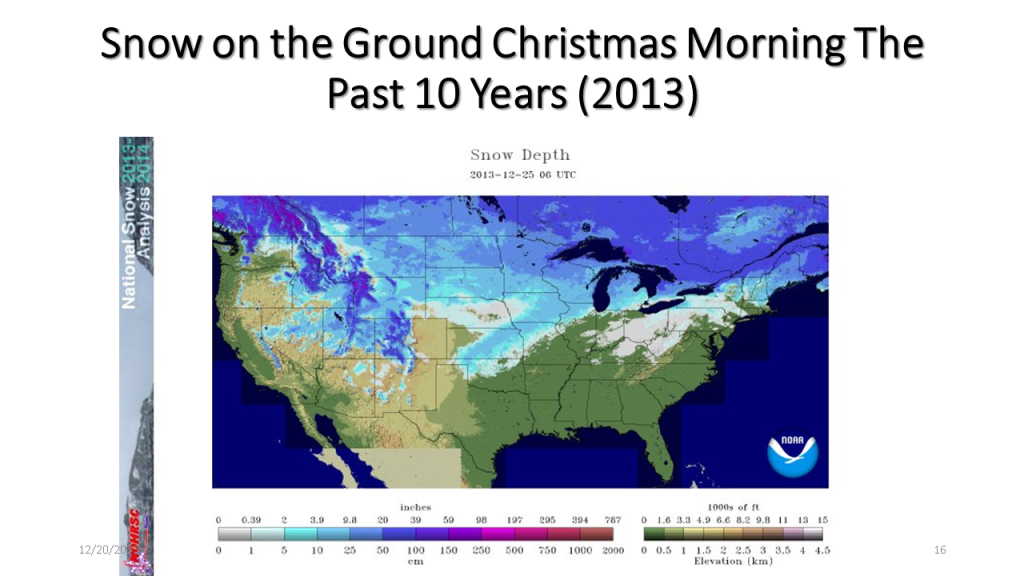
| Area Covered By Snow: | 41.7% |
Below is a table showing the percent snow cover on Christmas
Below is a table showing the percent snow cover on Christmas Day in chronological order.
Below is a table showing ENSO numbers and the percent snow cover on Christmas day for that year sorted from the highest percent snow cover to the lowest. There does not seem to be a significant correlation to the ENSO state and the percent snow cover on Christmas Day.
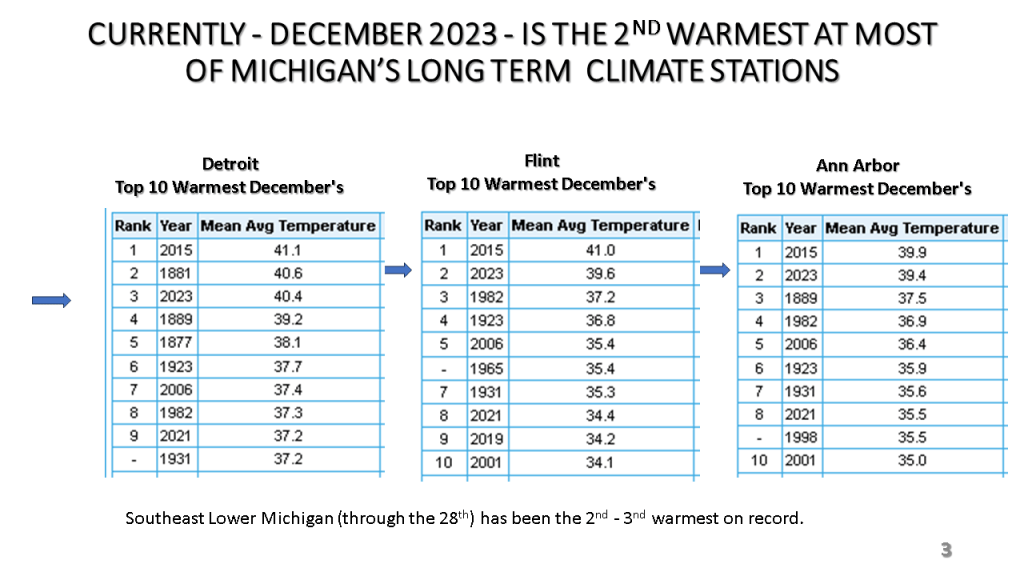
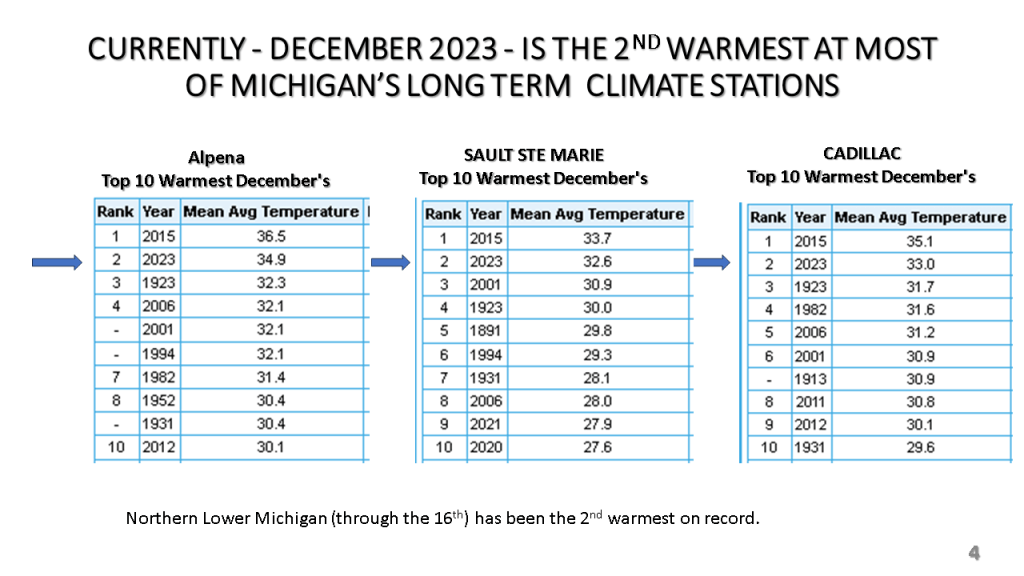
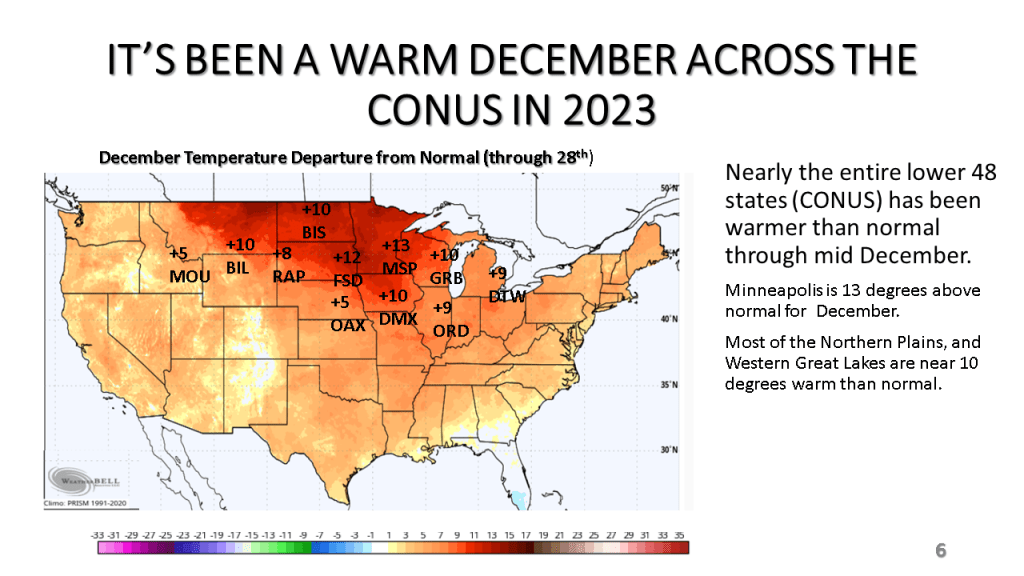
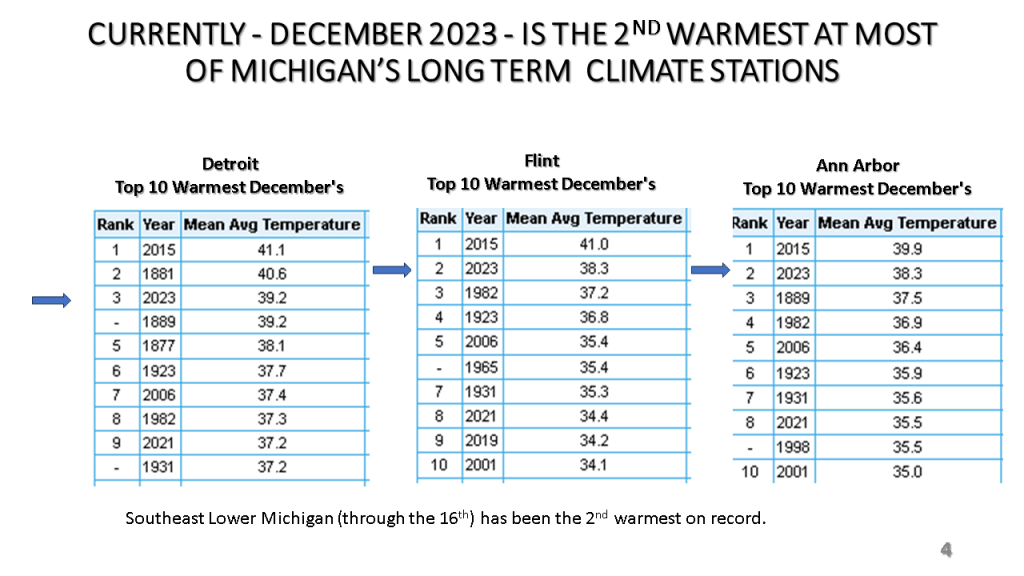
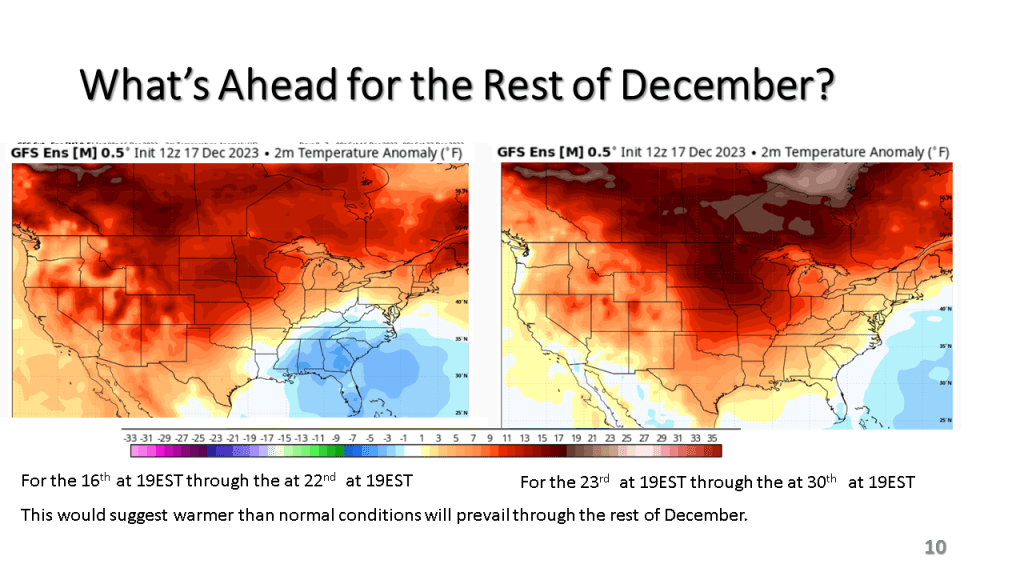
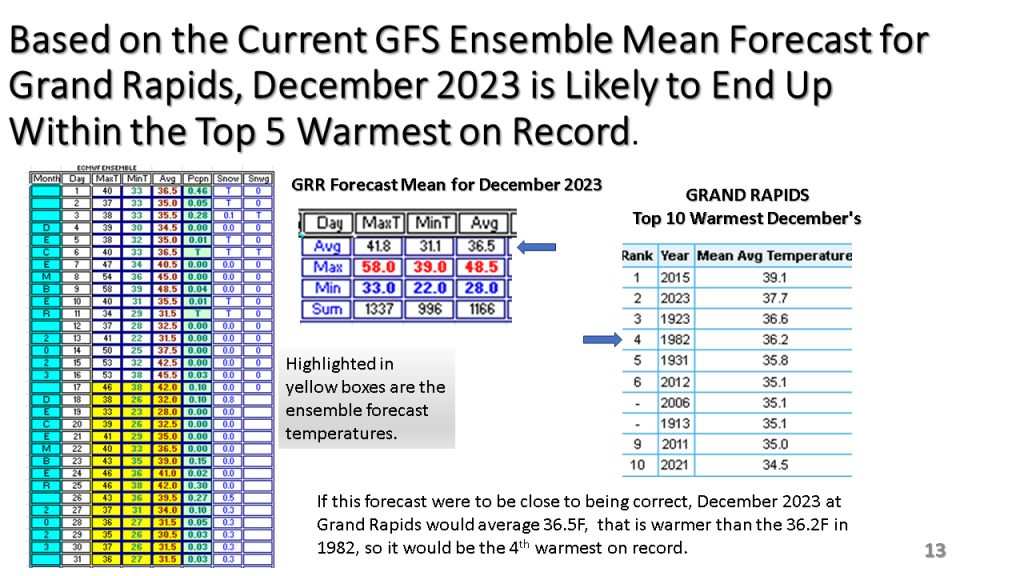
So far, as of the 16th, December is averaging 6 to 8 degrees above normal across Southern Lower Michigan. Flint is warmest with +7.8, while while Grand Rapids is the least with +5.5. Most other climate sites are between 6 and 7 degrees warmer than normal through the 16th in Michigan. Over northern Michigan Alpena has the least positive departure with +4.1 while Gaylord is +5.9 and Traverse City is +5.1. We are expecting two cold days (Monday and Tuesday) but the rest of December is expected to well above normal. Thus, December 2023 is likely to be in the top 5 warmest on record over most of Lower Michigan.


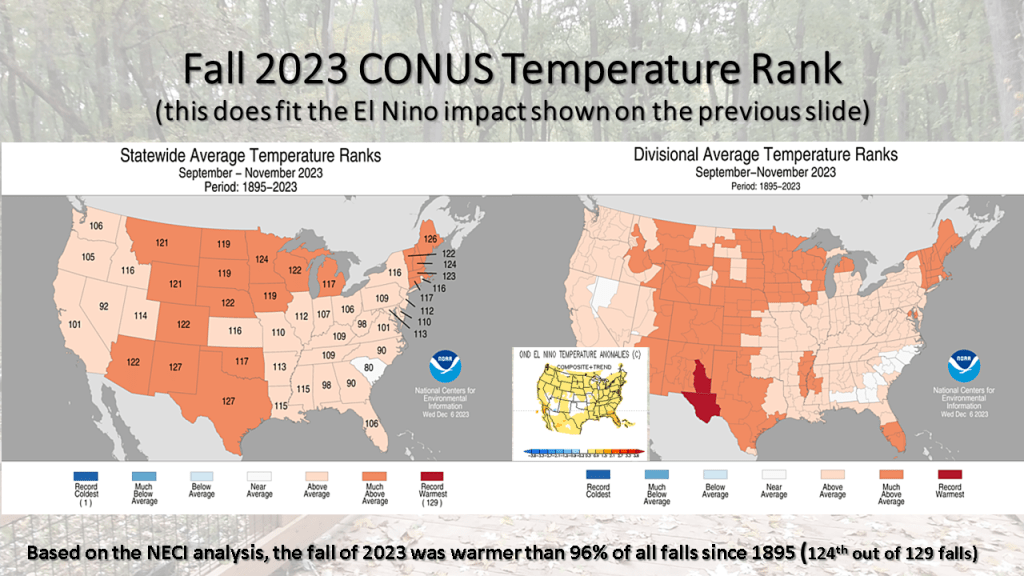
In our string of nationally much warmer than normal seasons, the fall of 2023 was 124th out of 129 falls for warmer than normal. This puts this fall warmer than 96% of all falls since 1895! No area of the CONUS had a below normal temperatures (bottom 1/3 coldest) this fall.


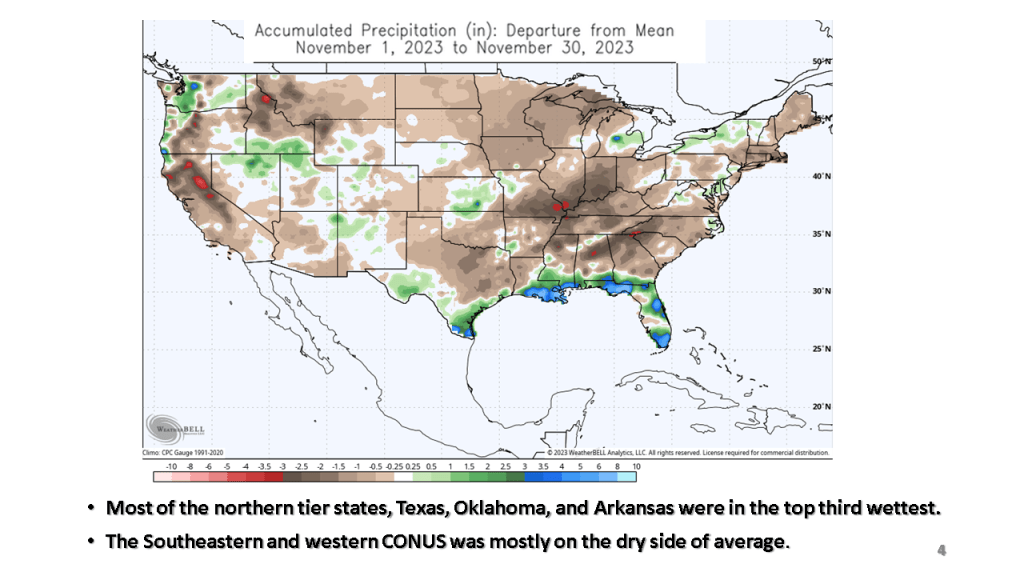
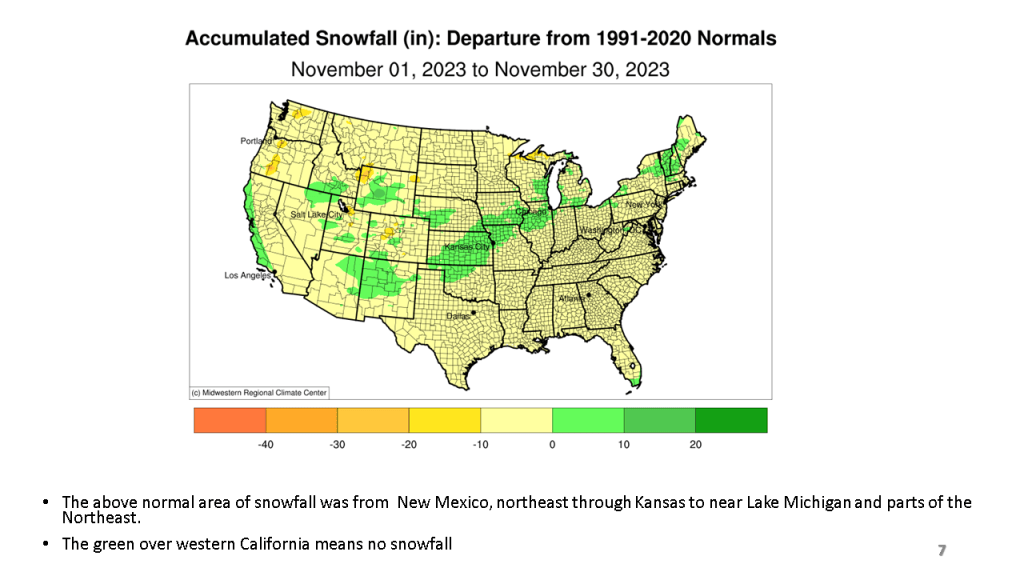
For the most part, November was not was warm, relative to normal as October was, in fact the eastern half of the CONUS was cooler than normal in November, as were parts of the Pacific Northwest. It was an extremely dry month over most of the CONUS, ranking 111th dries out of 128 years (91%). Only the Gulf Coast and Florida were wetter than normal. Snowfall was mostly below normal but a snow storm brought heavy snow from Kansas to near Chicago around the 25th resulted in up to a foot of snow in that area, bringing them above normal snowfall for November.


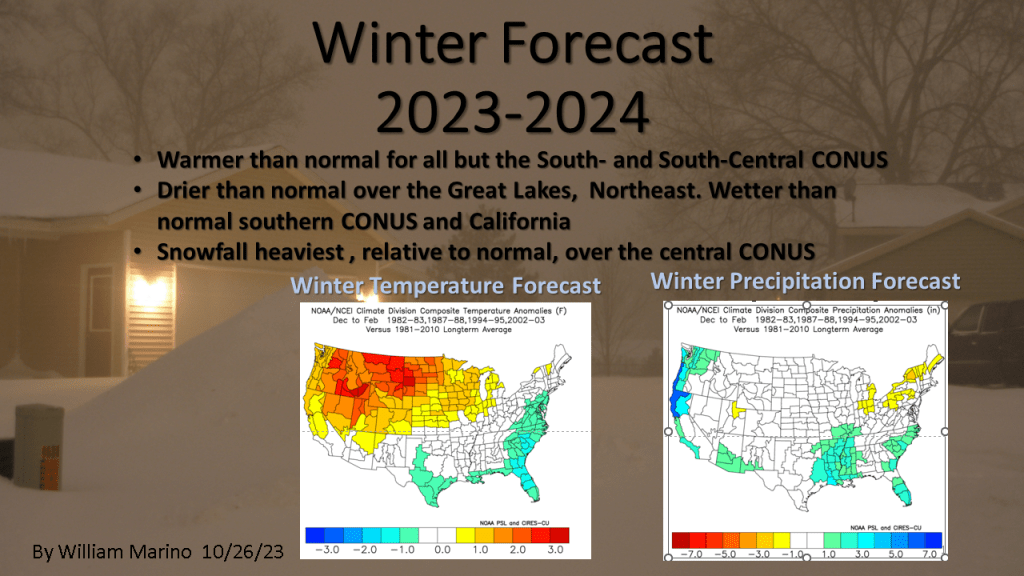
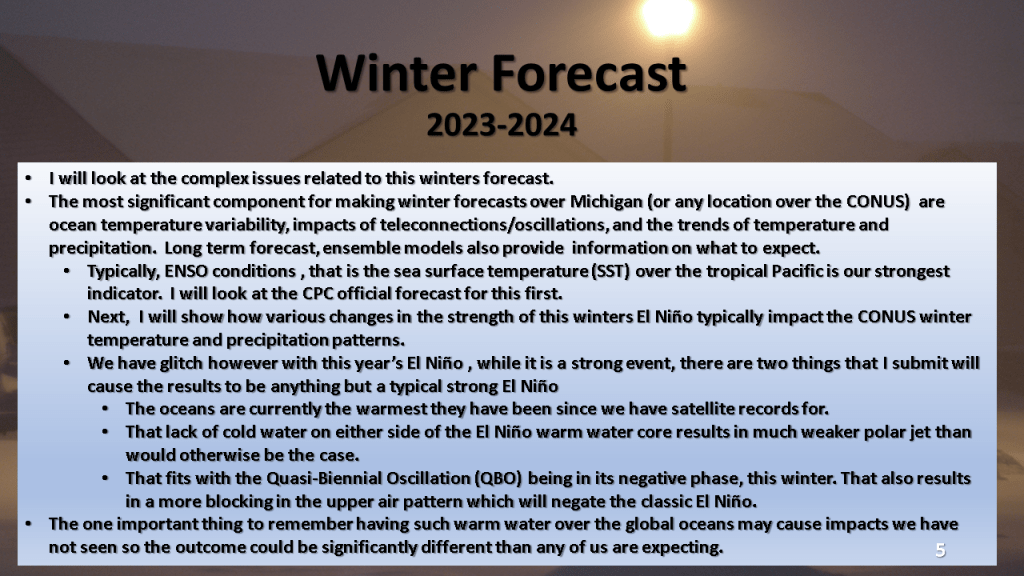
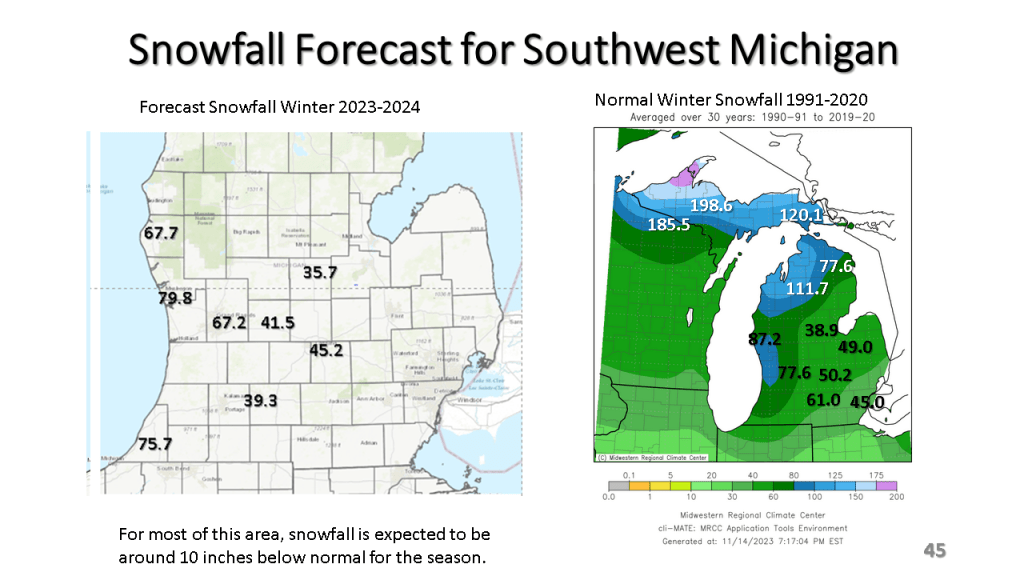
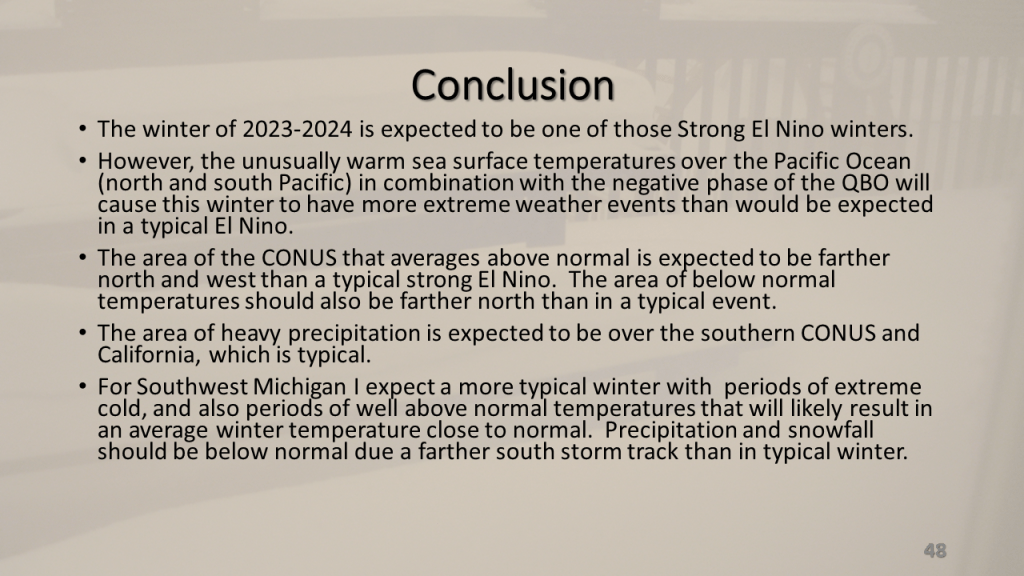
The short story is I am expecting a not so typical moderate to strong El Nino Winter this year. This is due to record warm sea surface temperatures in combination with an easterly wind over the tropical oceans, near 200 mb. This these two features acting together create an unusual amount of blocking in our Northern Hemisphere jet stream. This will mean periods of extremely cold weather and periods of unusually warm weather for a good part of the central and eastern United States lower 48 states. Even so, for Southwest Michigan and actually for all of Michigan I expect snowfall to be below normal but we will get a decent amount of snow nonetheless.