(over the Midwest and Great Lakes)
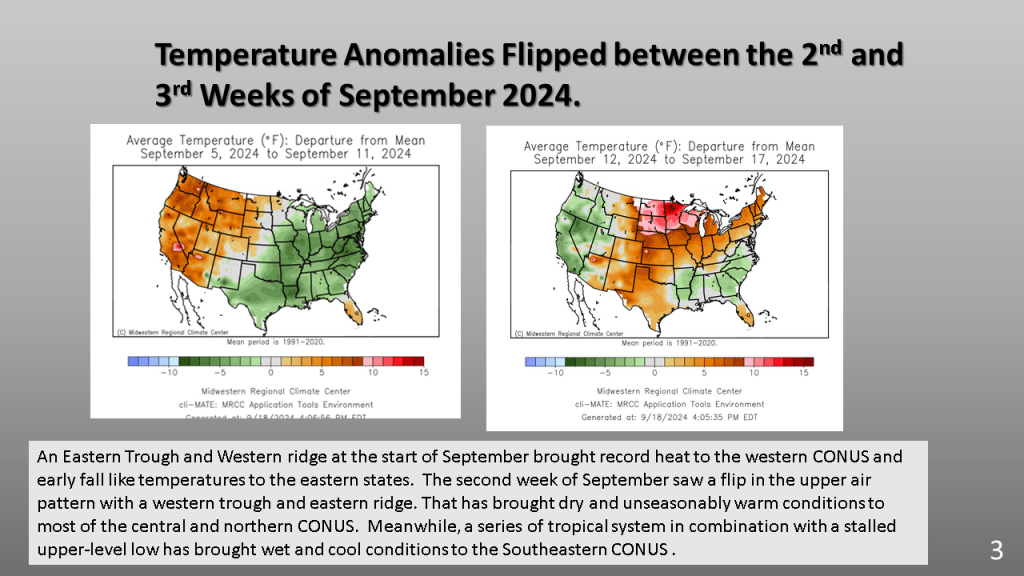
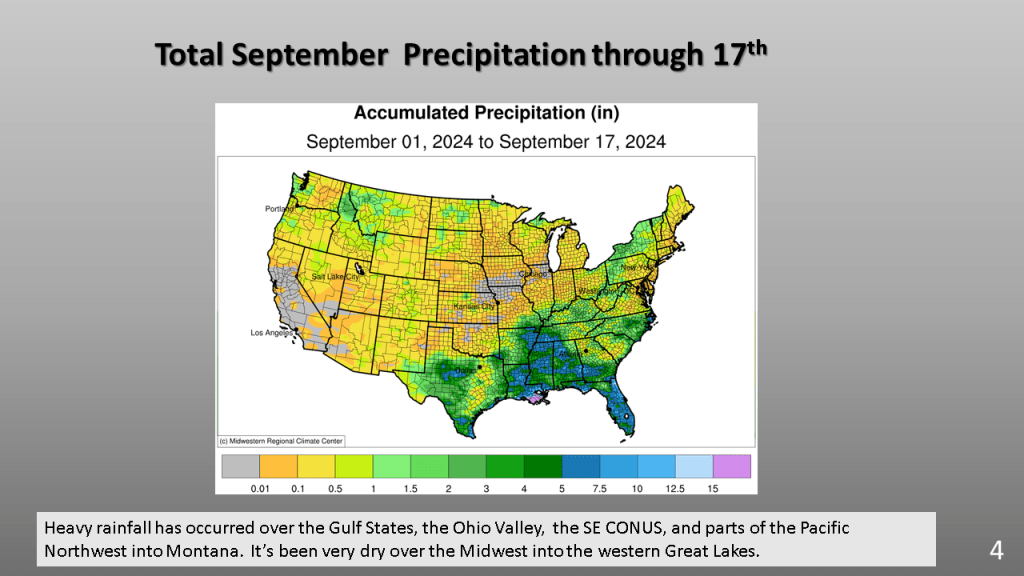


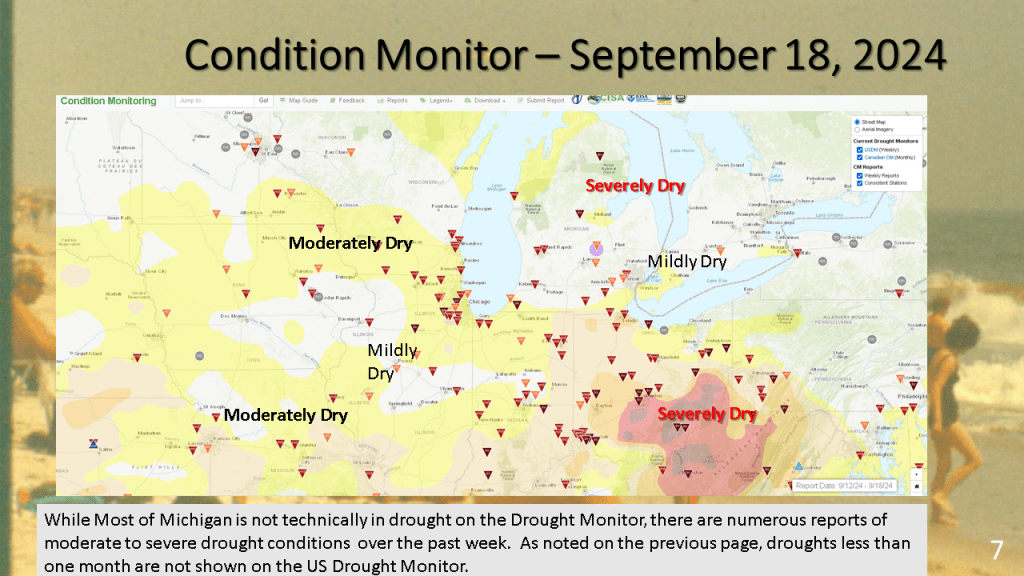


(over the Midwest and Great Lakes)
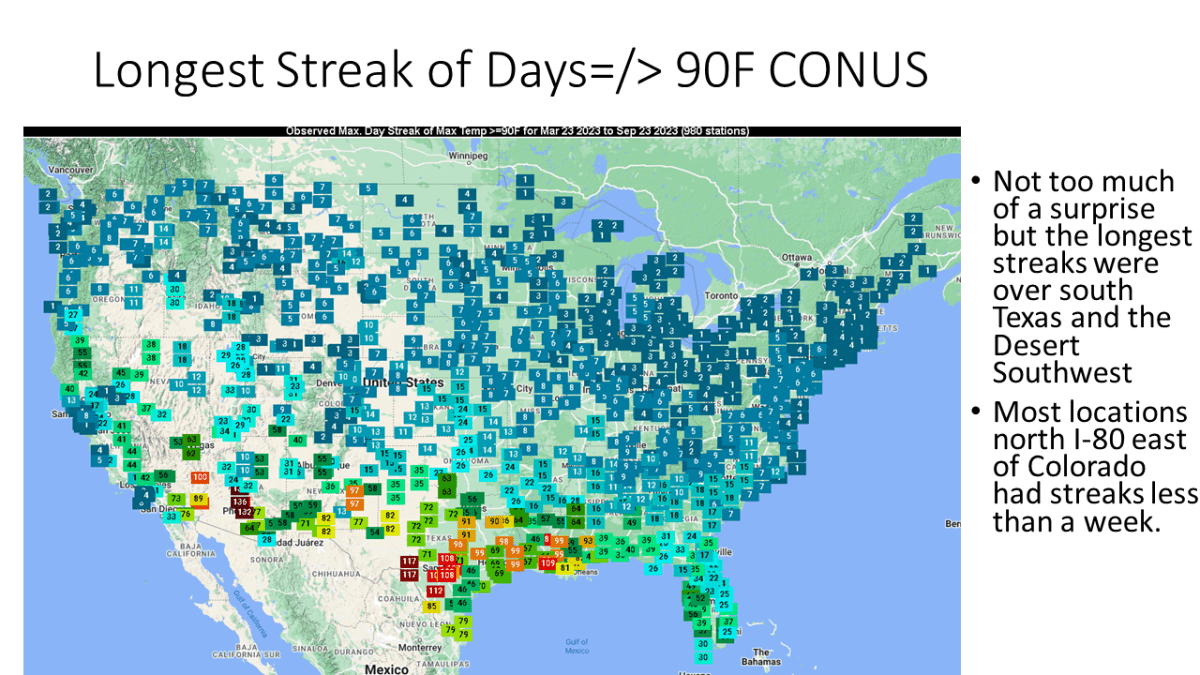
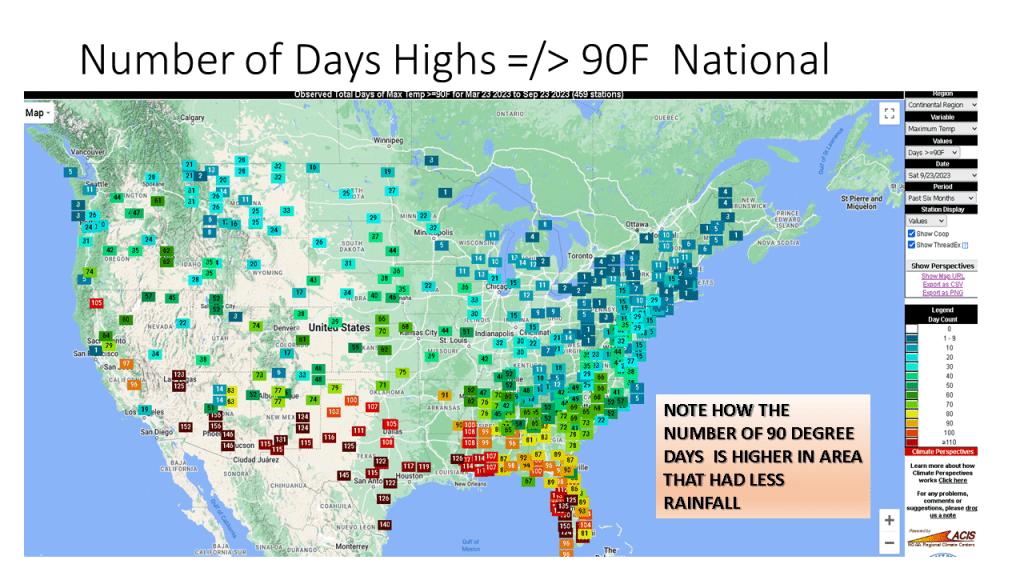
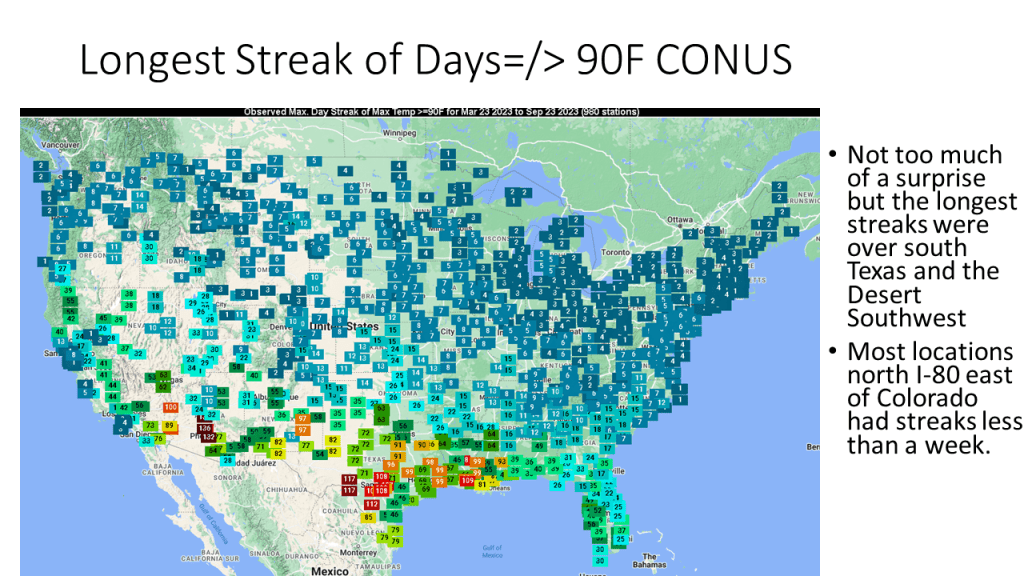
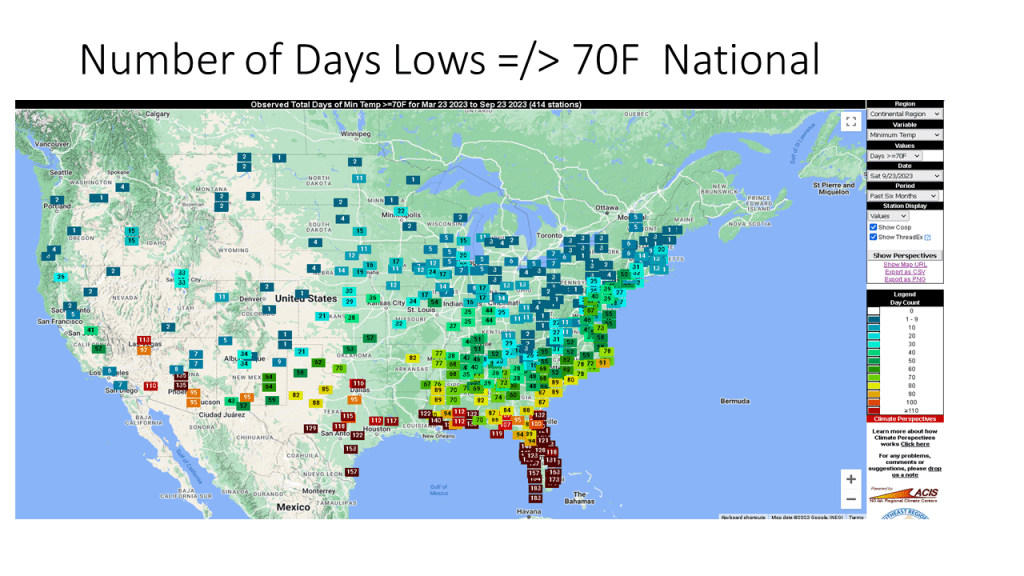
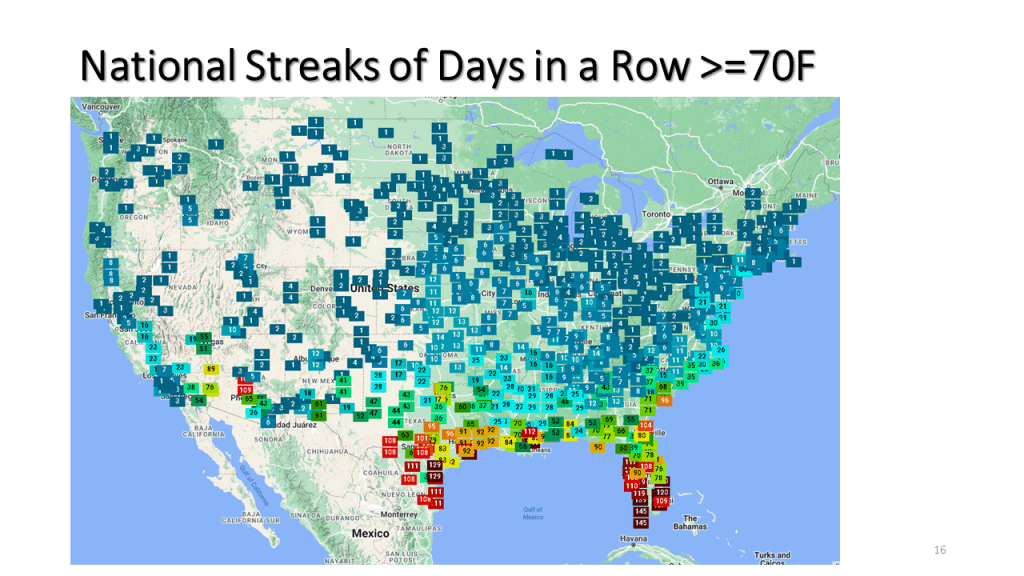
I through it would be fun and informative to see the frequency for hot days across our Nation.
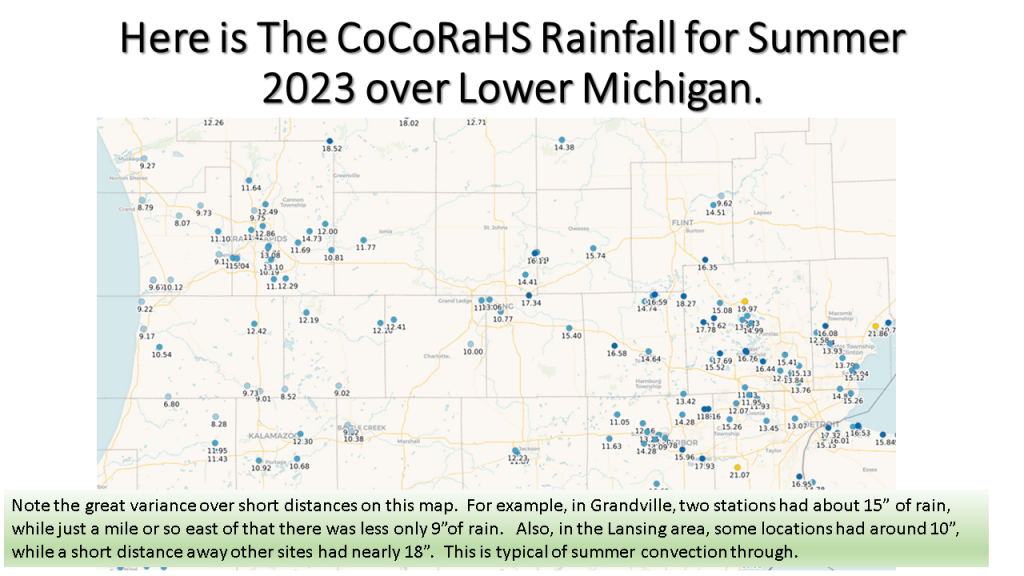
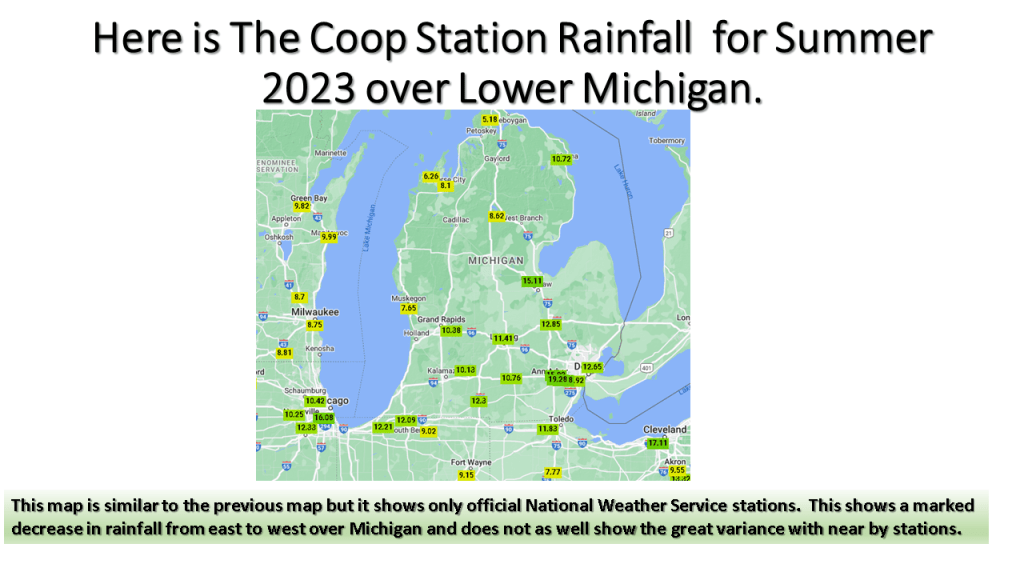
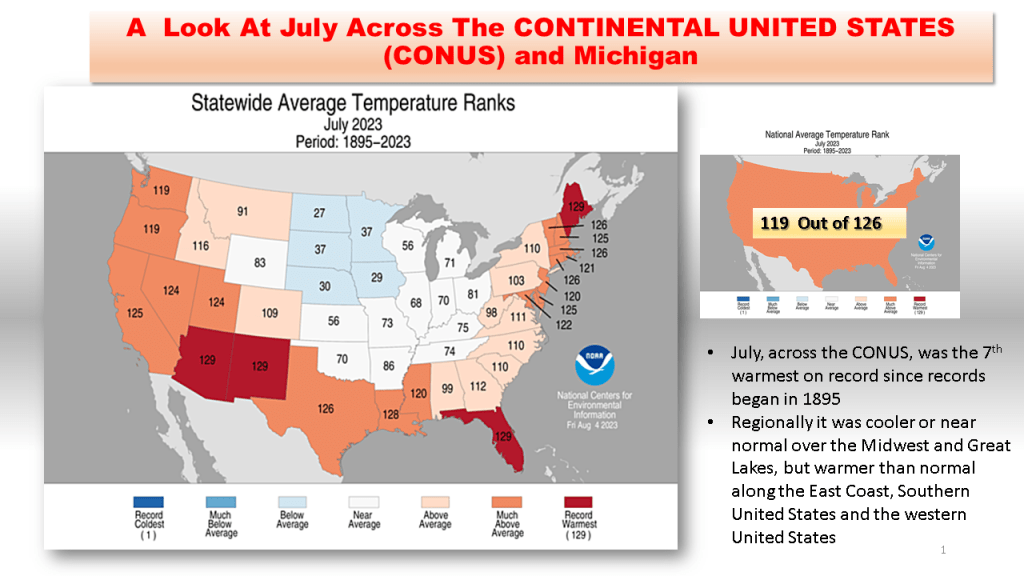
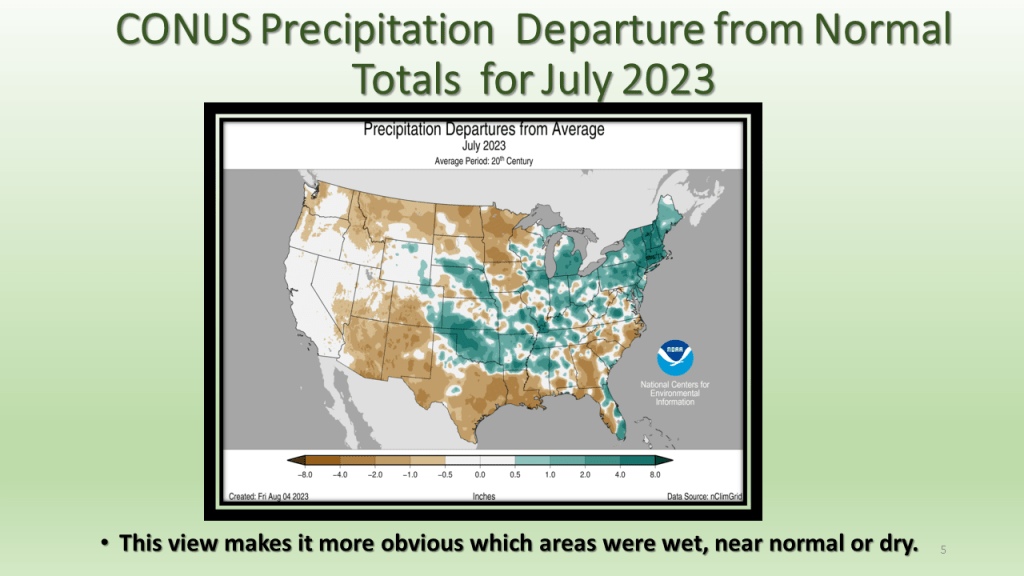
Here I have the frequency for highs in the 90s across the CONUS (Continental United States), the longest streak across the CONUS, the frequency of lows of 70 or more and I few more NCEI charts to show how hot of a summer this was both nationally and regionally. I also have a few precipitation maps so you can see that the great frequency for hot weather was were it rained less, relative to normal for that area.
I have added 2 slides to this presentation ( 8 and 9). These two slides show that what one uses for the “normal”, greatly impacts what the departure from normal looks like. I used 1991 to 2020, the official NWS normal period for the image on the top left, then 1895 to 2000 for the image on the top right, not the area of below normal is significantly less. That is because the period 1991 to 2020 was warmer than the 1895 to 2000 period. On the bottom left the mean is 1895 to 2020, that has no below normal areas. This seems questionable to me since the ranked normal’s on the next slide look a lot like the 1895 to 2000 on slide 8. I added this because I was getting some questions on this matter. I hope this helps.







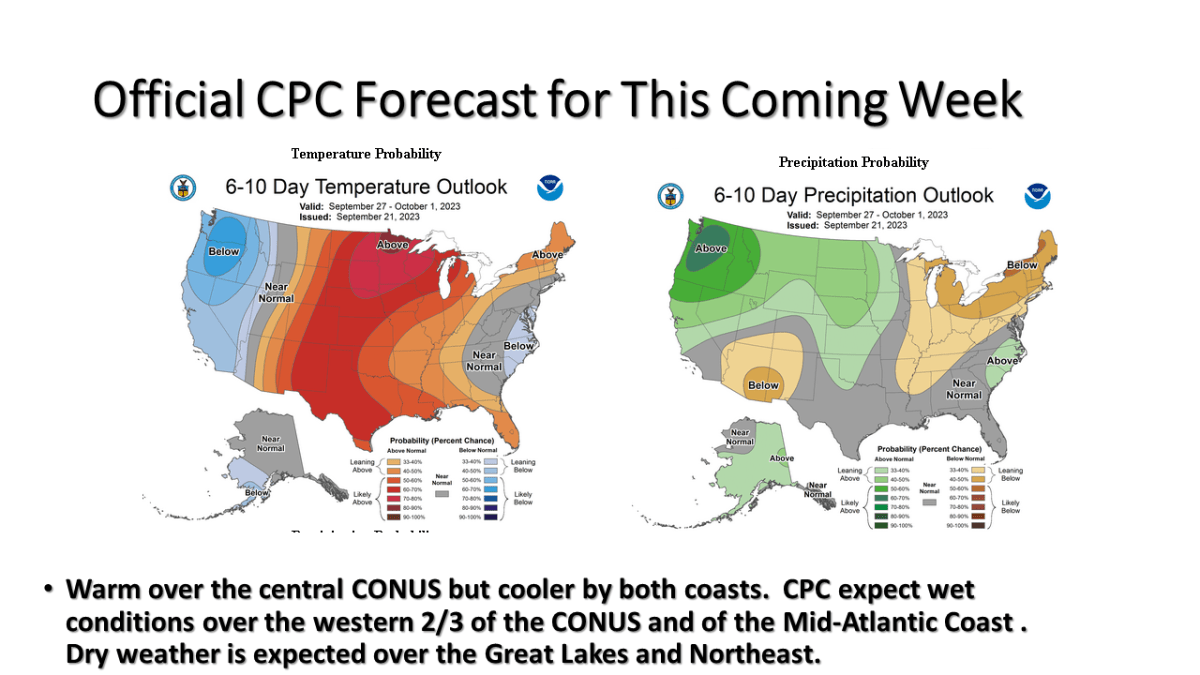
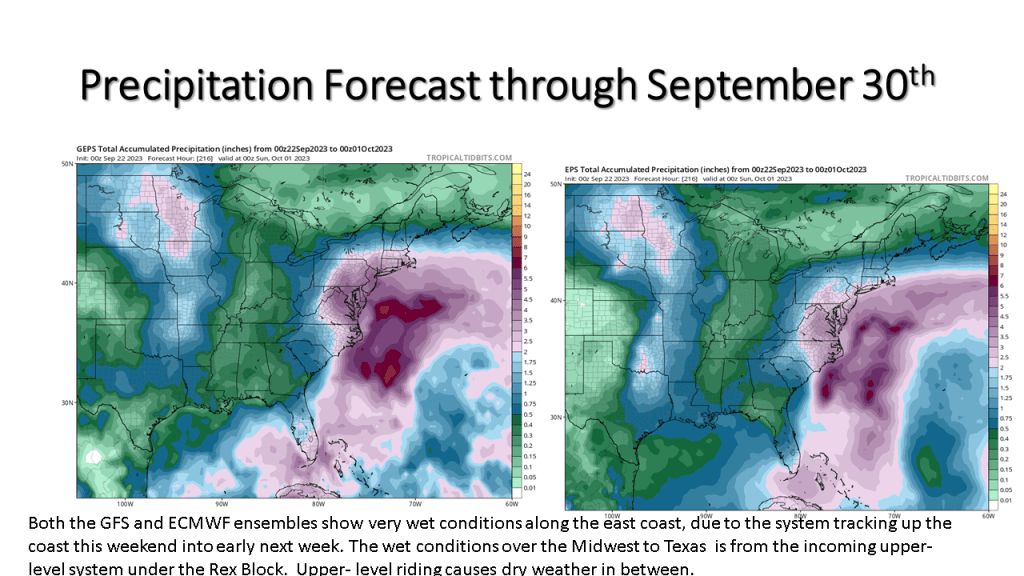
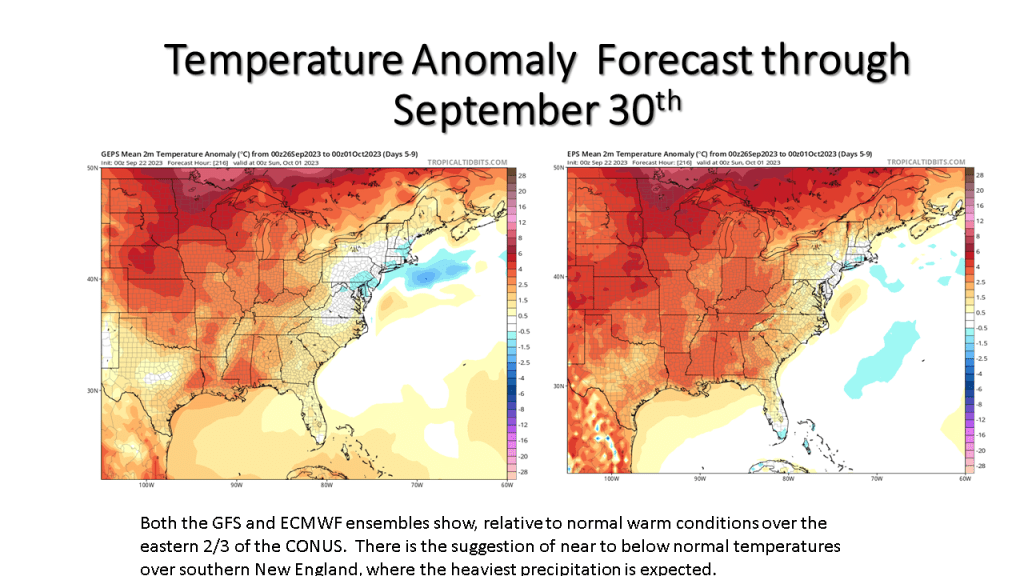
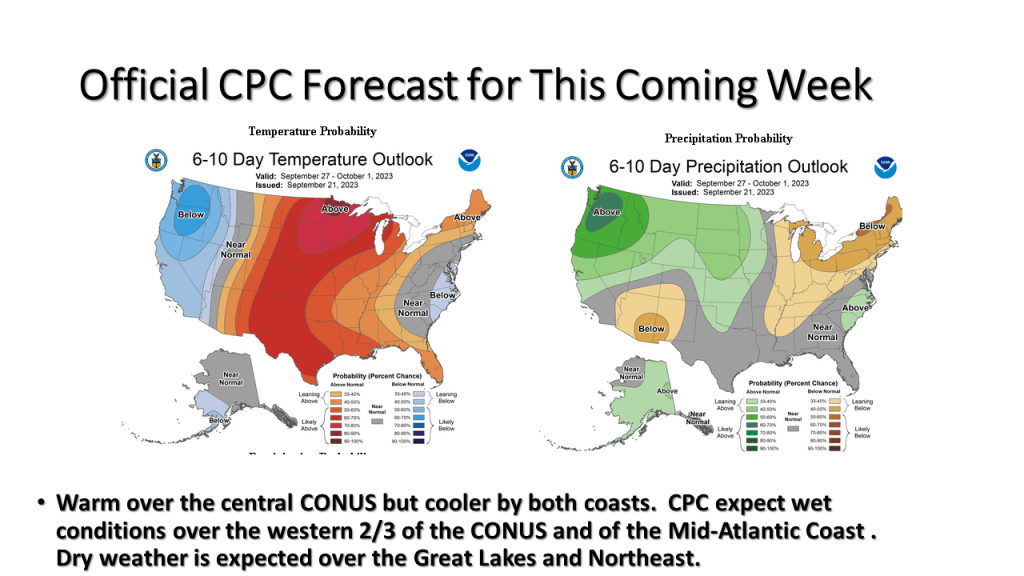
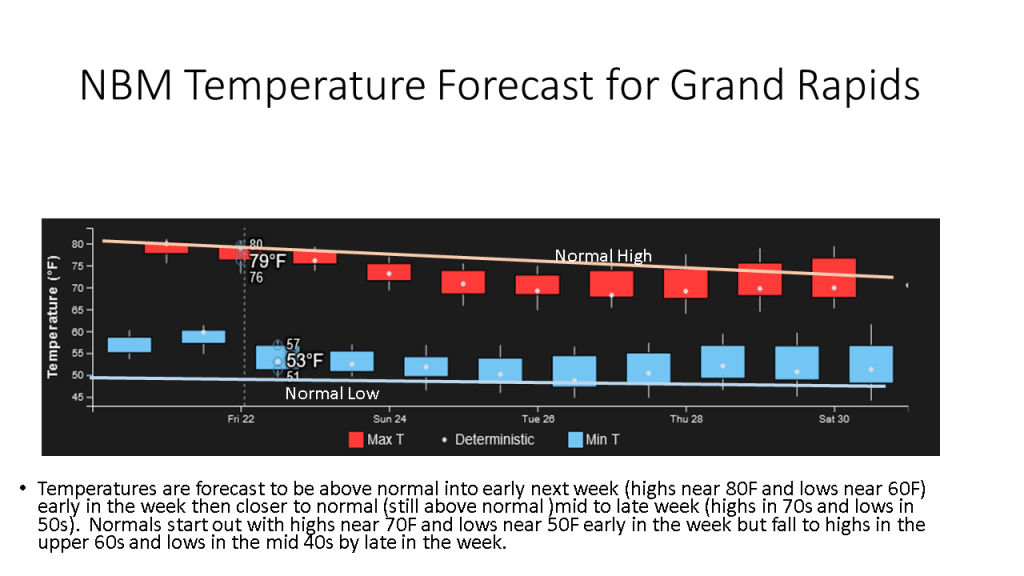
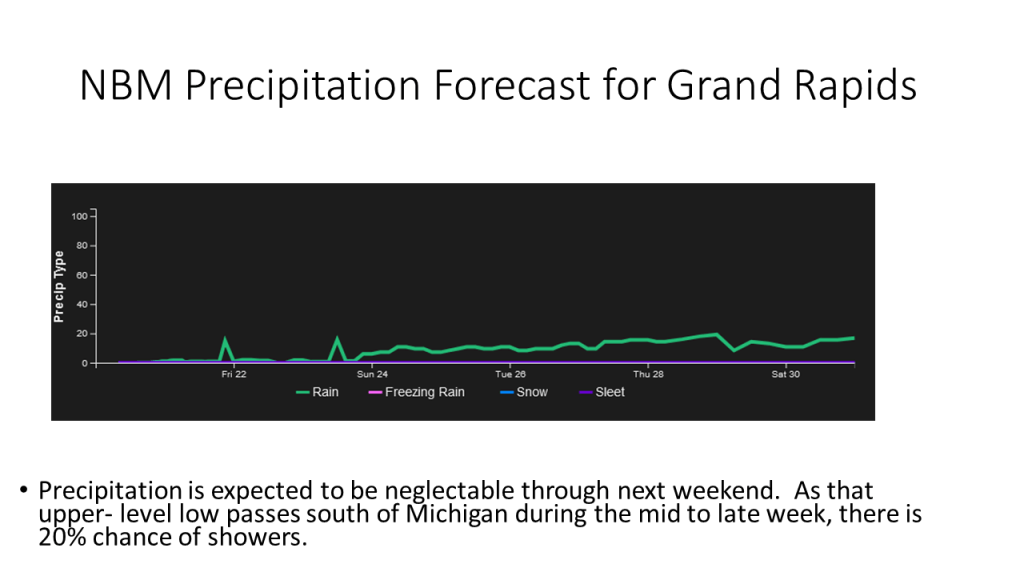
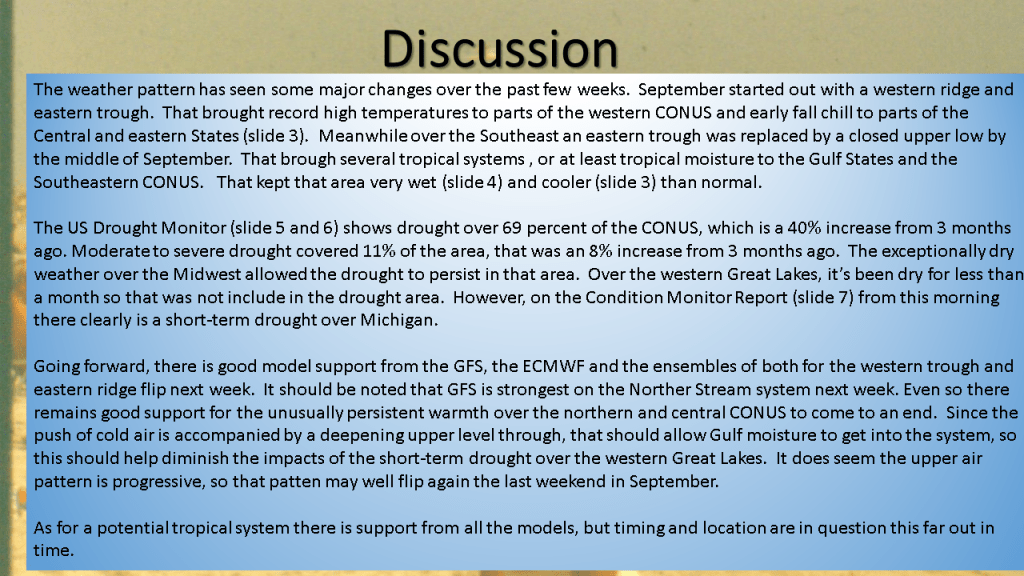
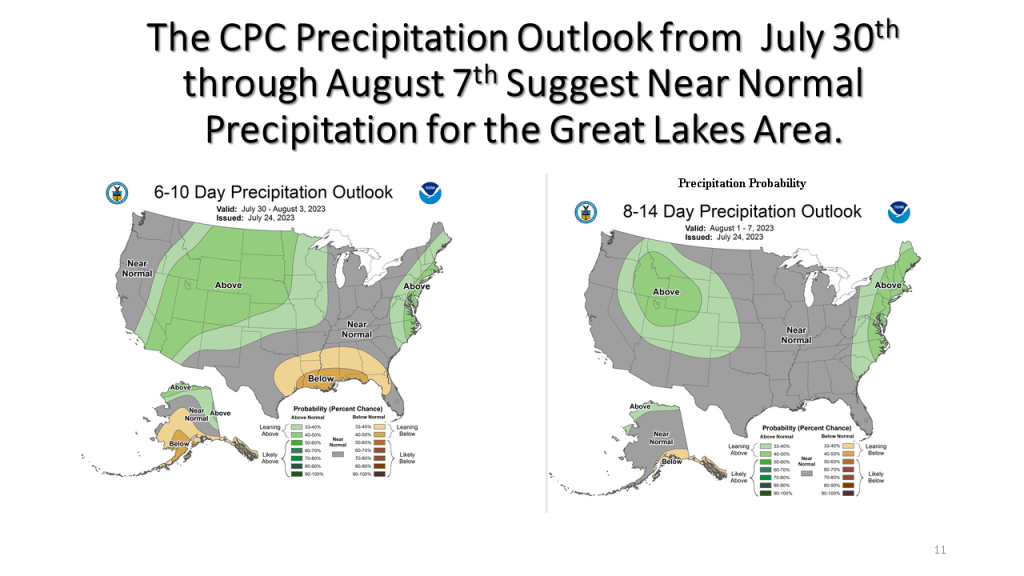
I am expecting warm and dry weather this week over Michigan but warm and wet over the east coat, and cool and wet over the west coast.
As promised I have posted the national images of July 2023. The short story is it was the 7th warmest and 45th wettest for the CONUS. In Michigan it was the 58th warmest and 5th wettest on record.



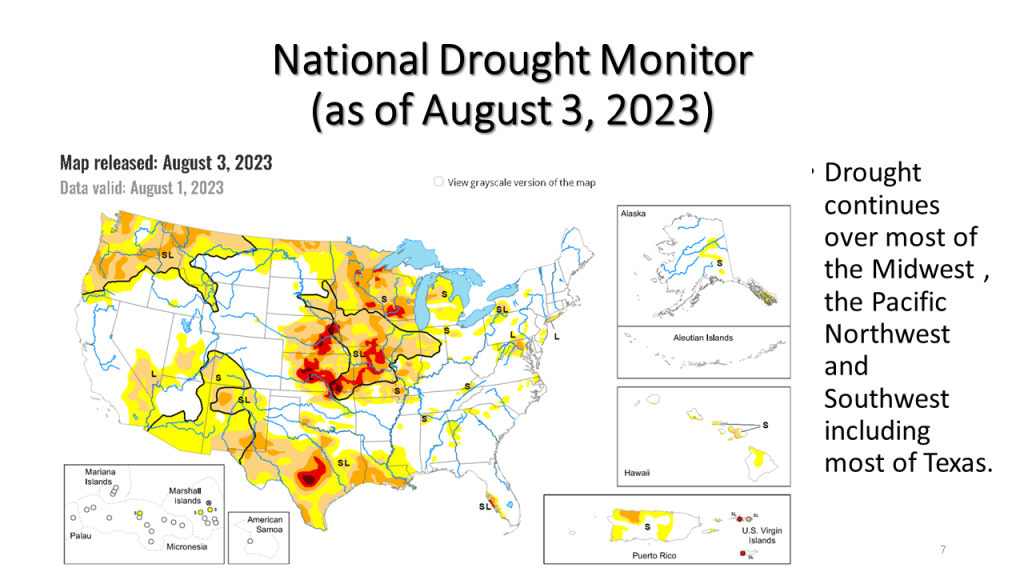
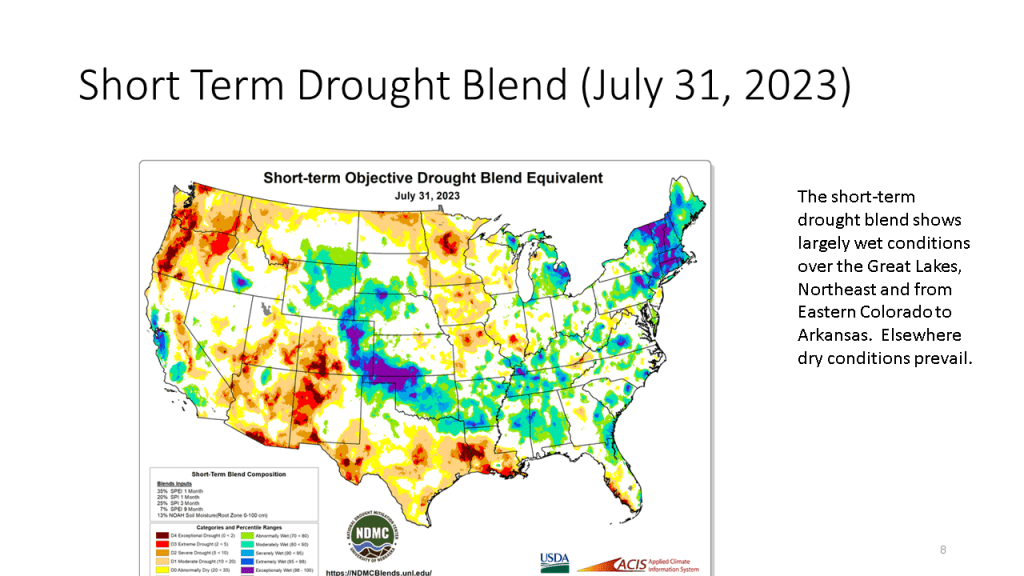


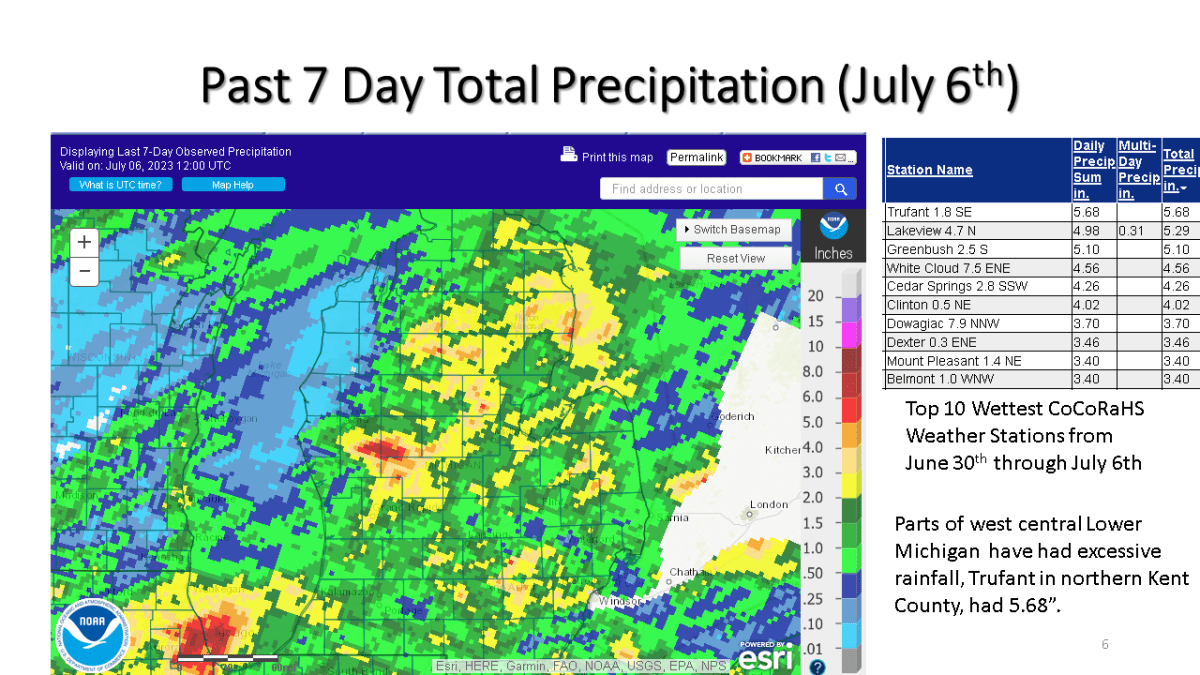
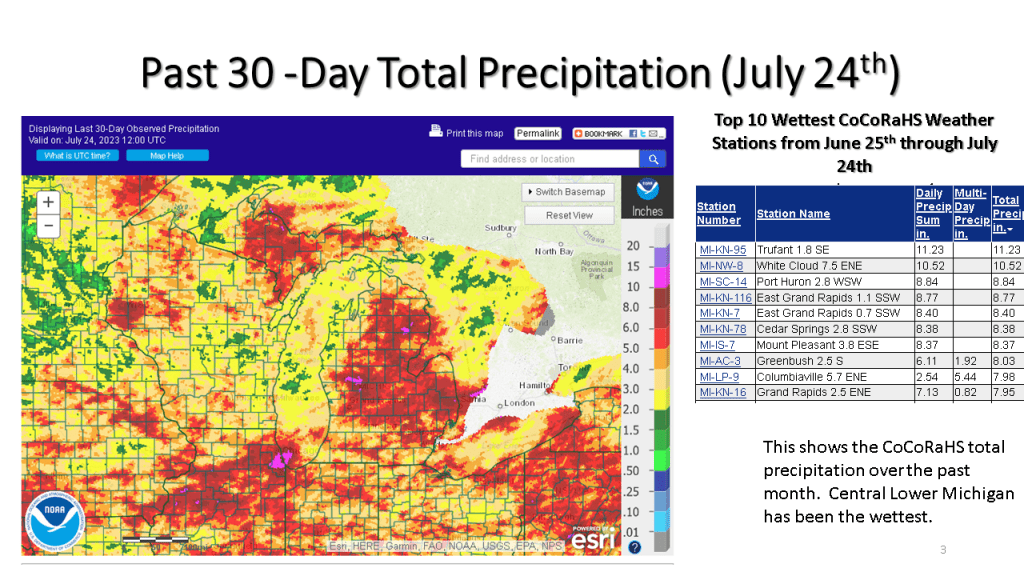
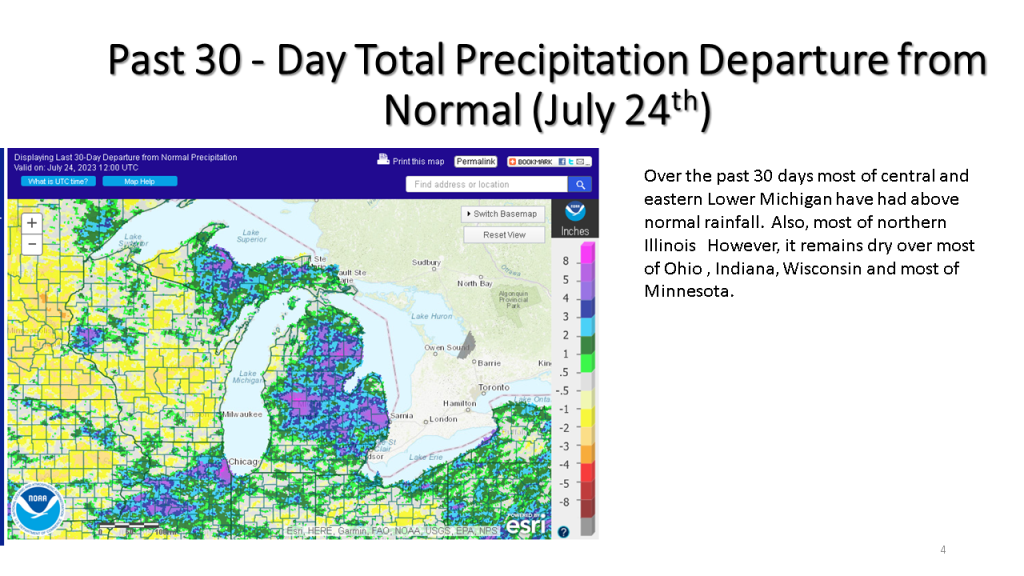
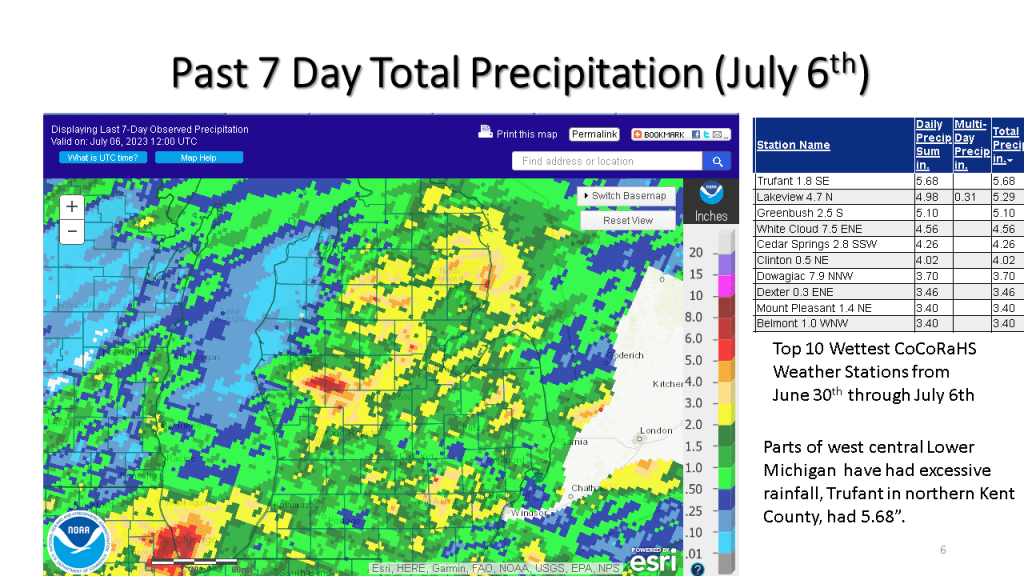
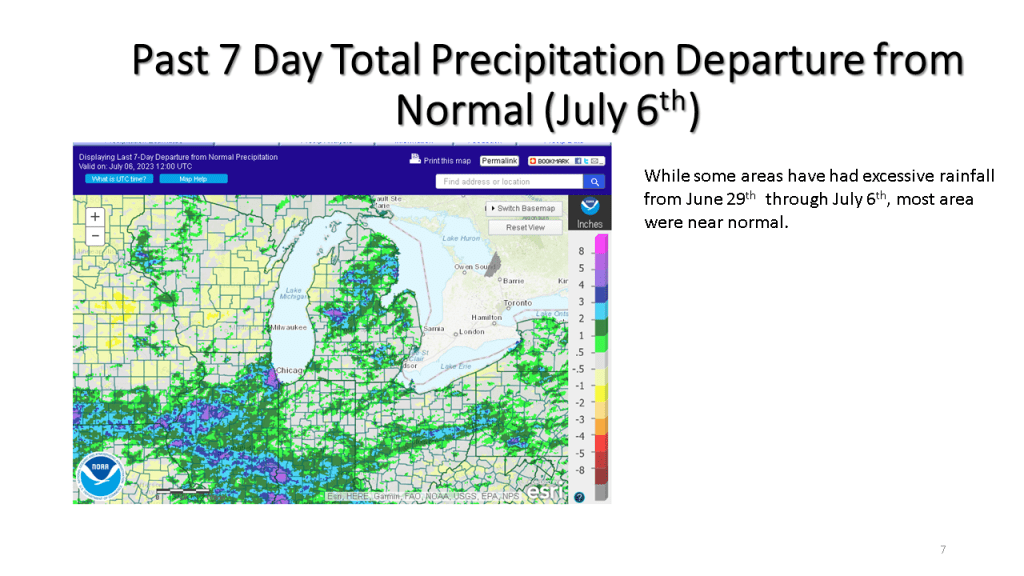
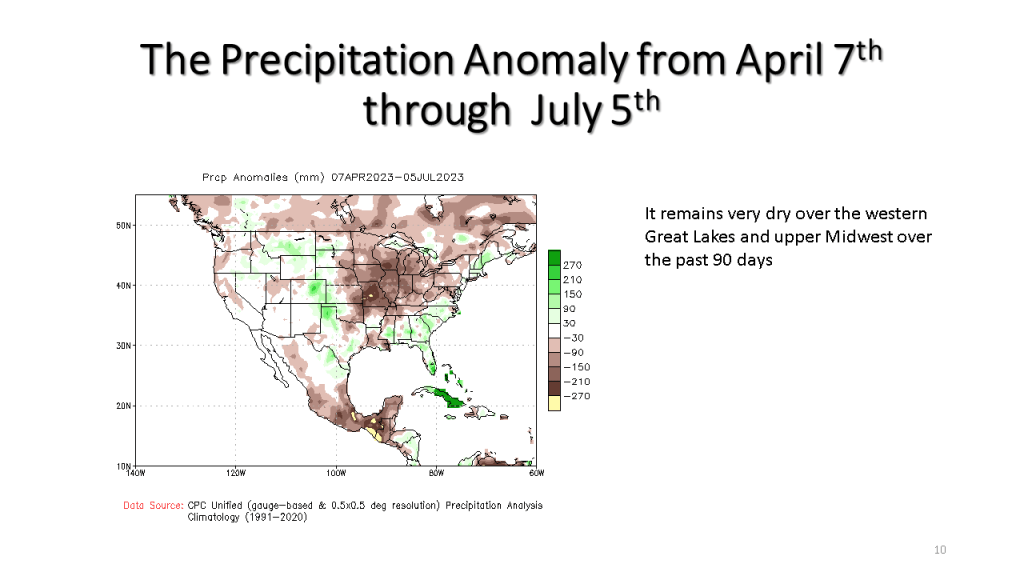
Area wide rainfall of 3 to 8 inches in July has helped reduce drought impacts but even so, the 90 day precipitation anomalies are still near 5 inches.
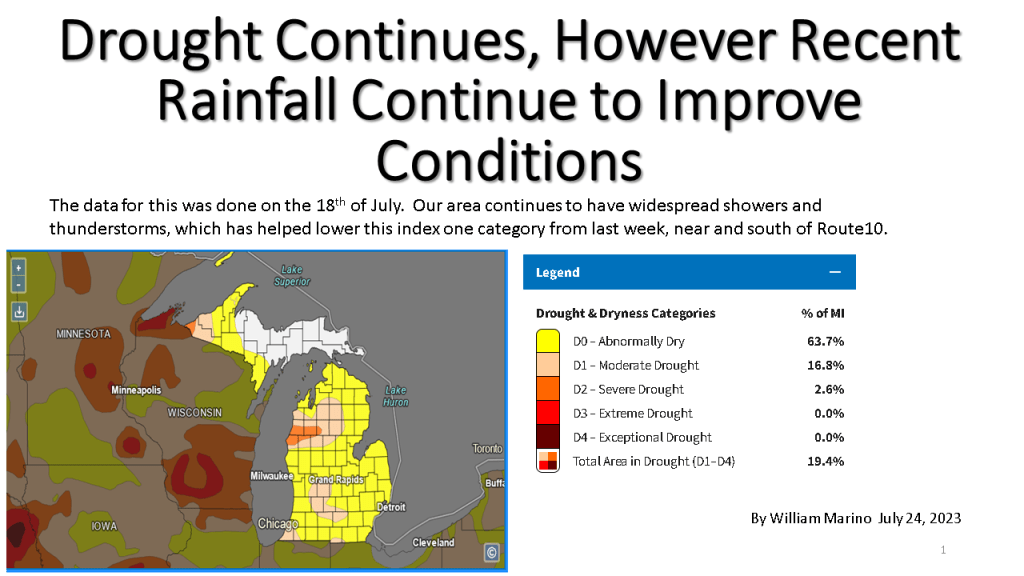
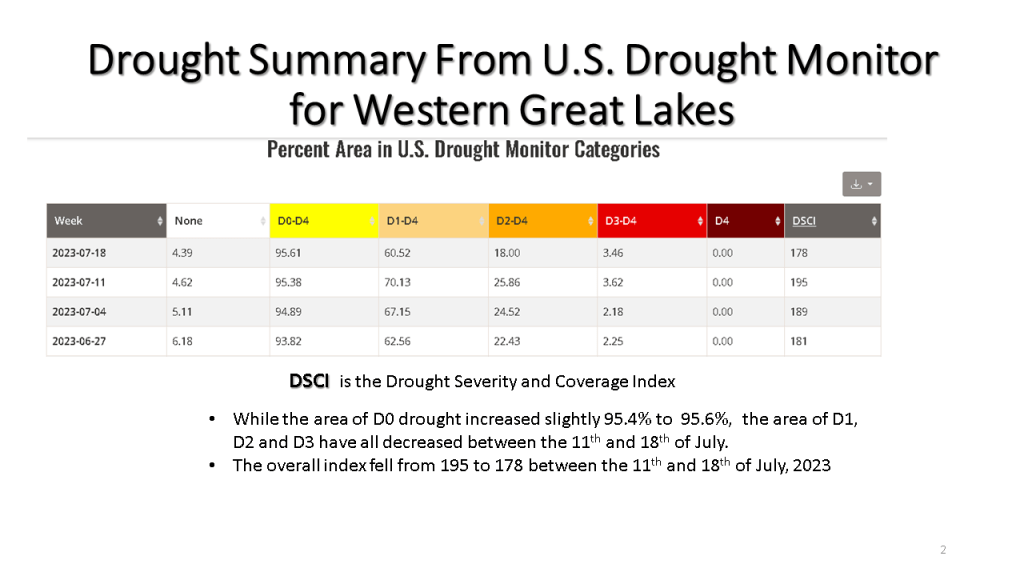




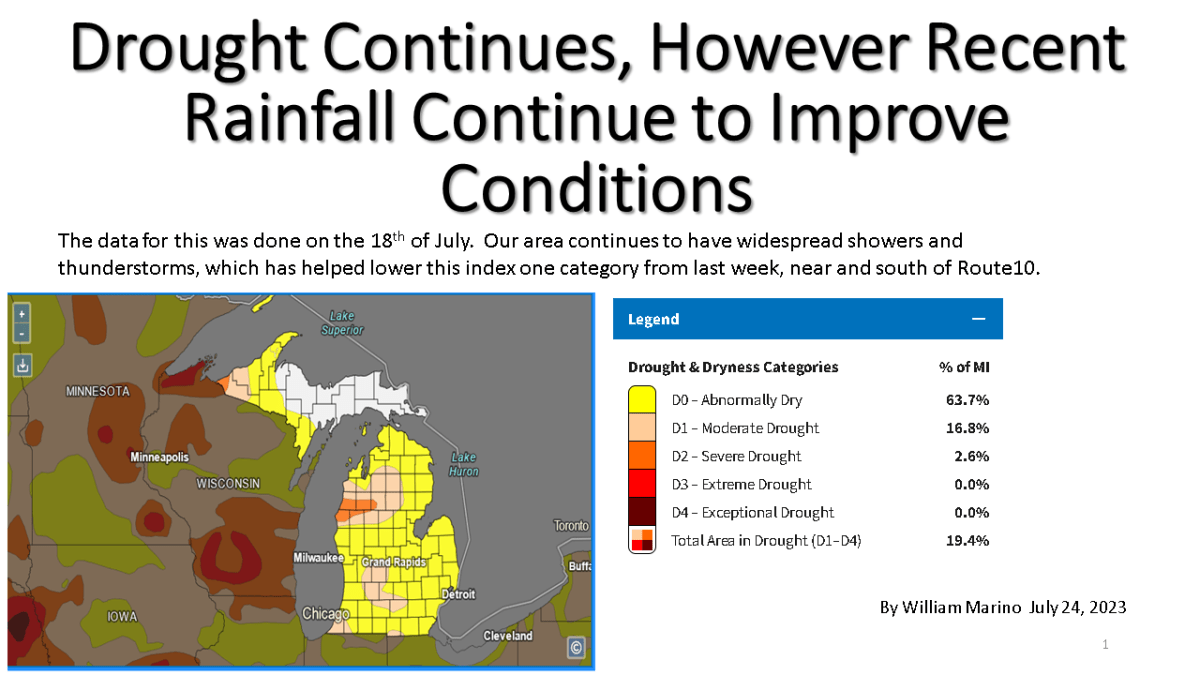
Drought continues
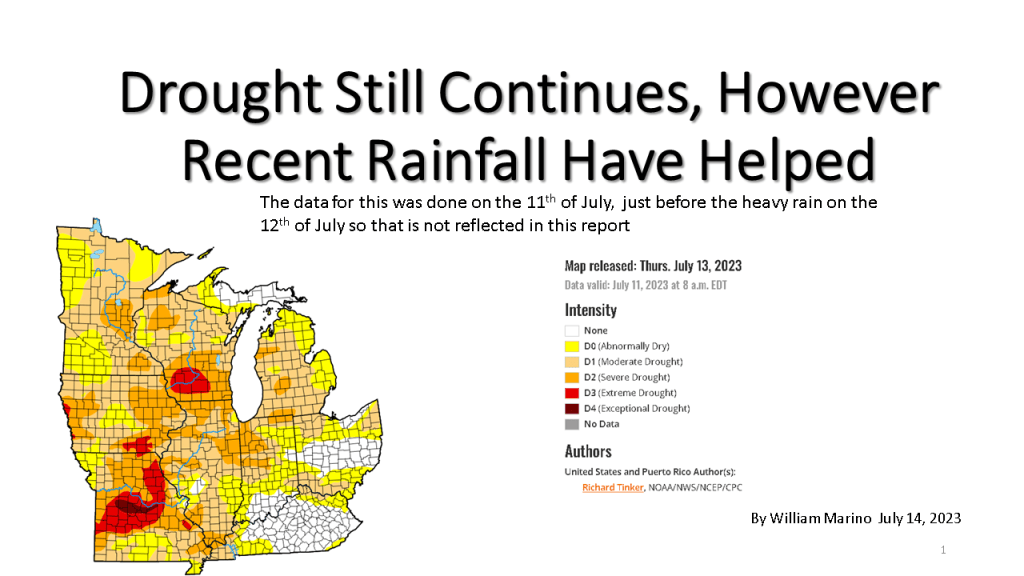
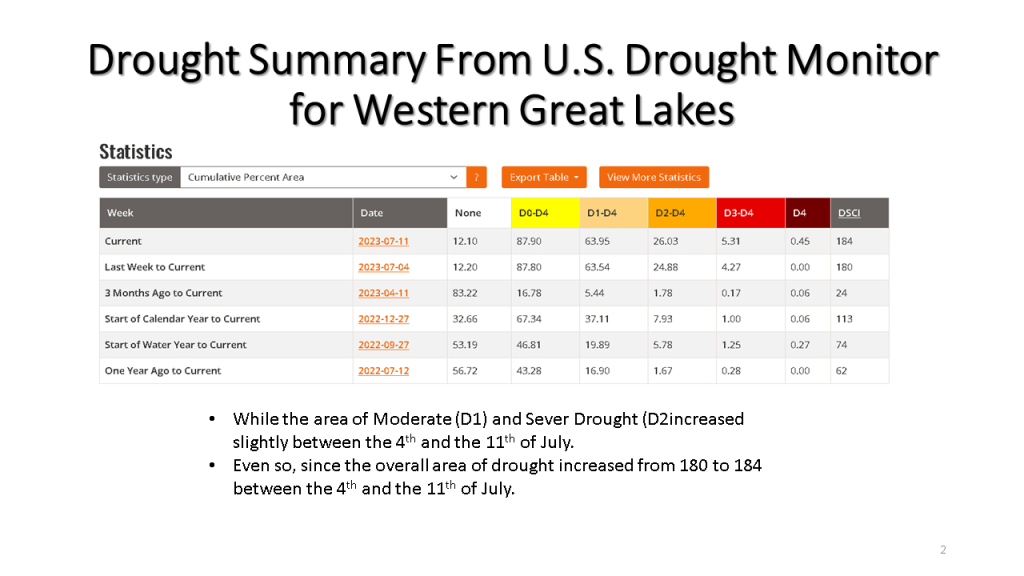
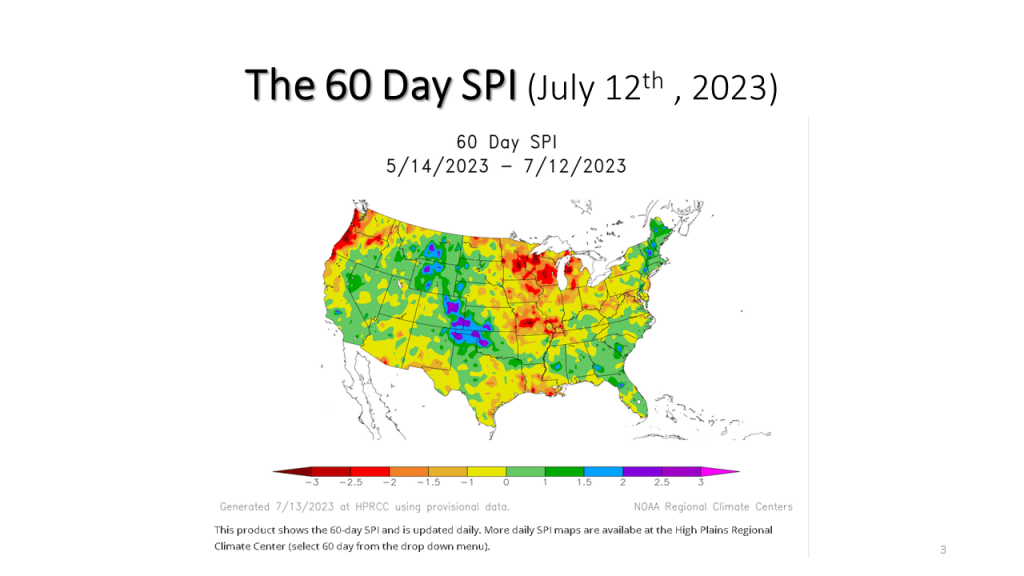
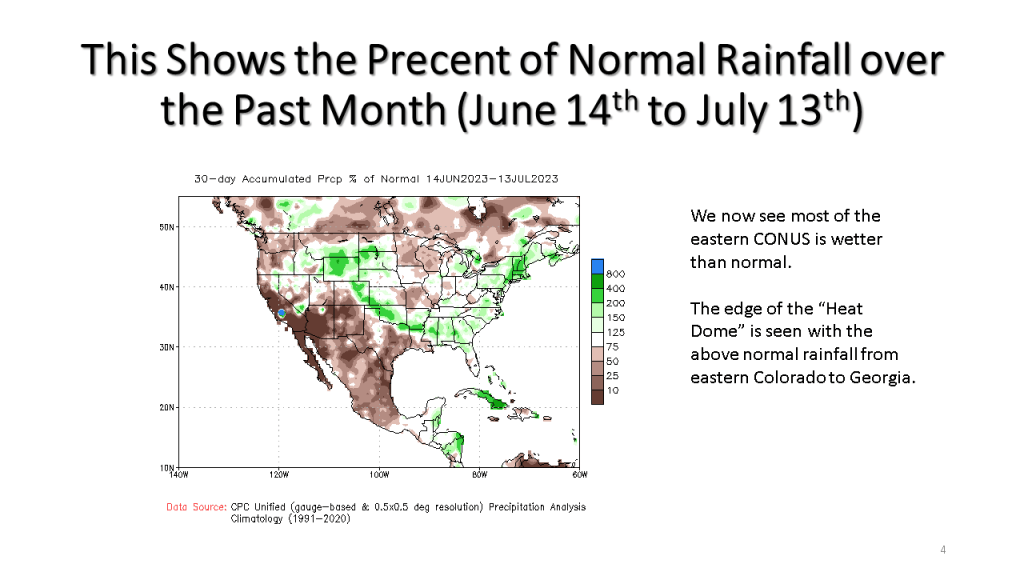
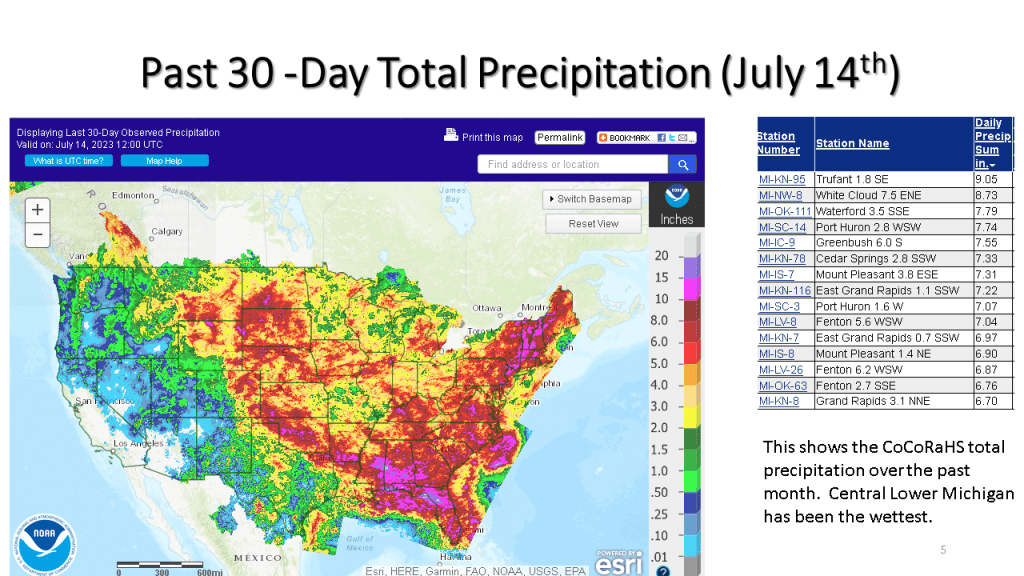


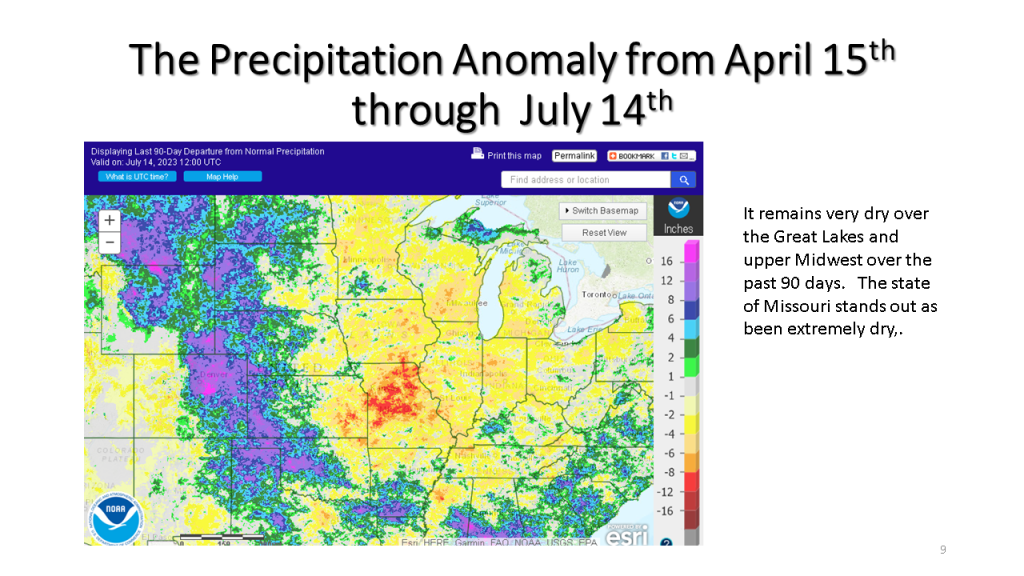


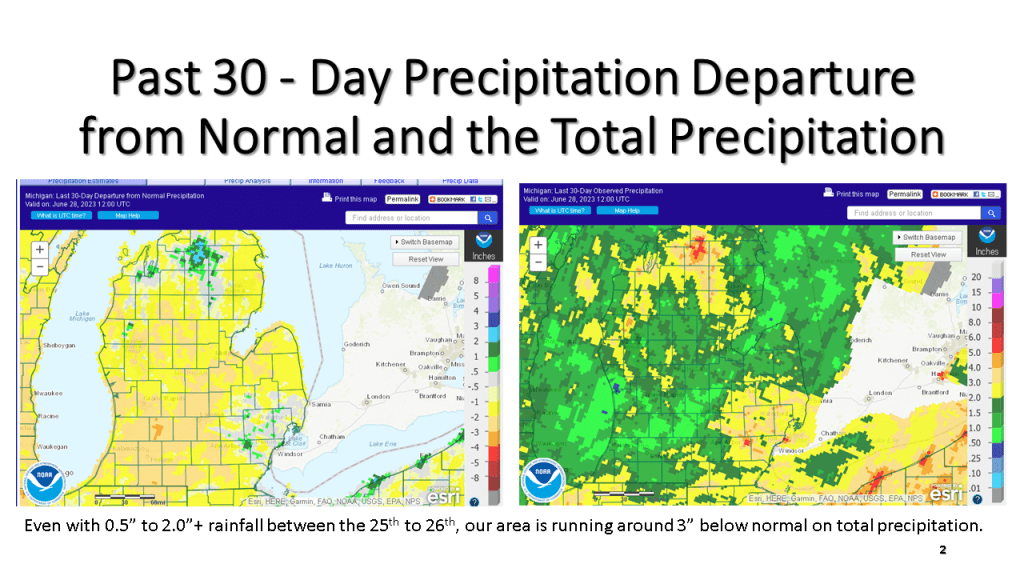
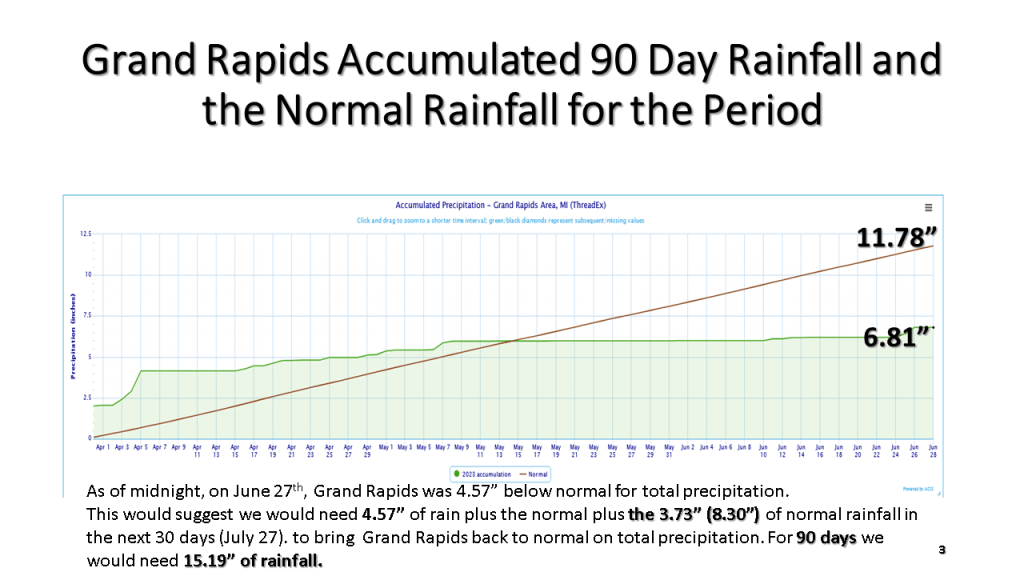
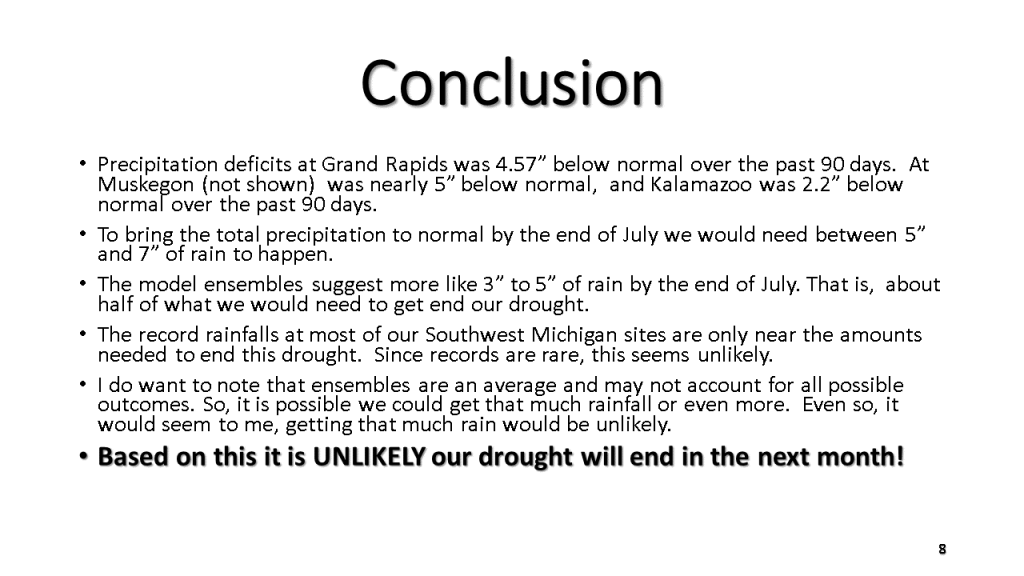
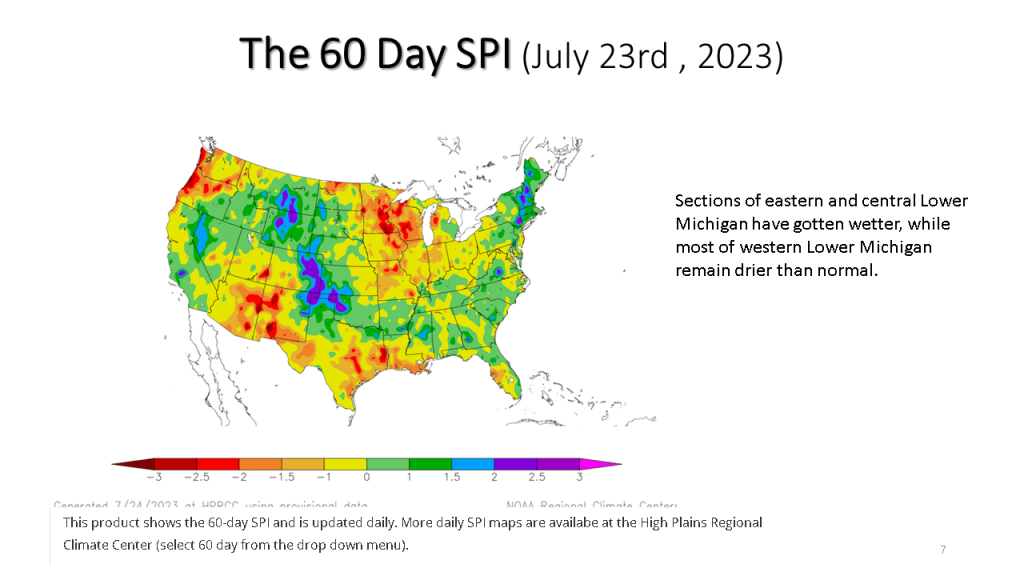
Recent rainfall has helped our drought improve some, but with rainfall anomalies being between 4 and 7 inches over the past 3 months, that has not come close to ending our current drought.
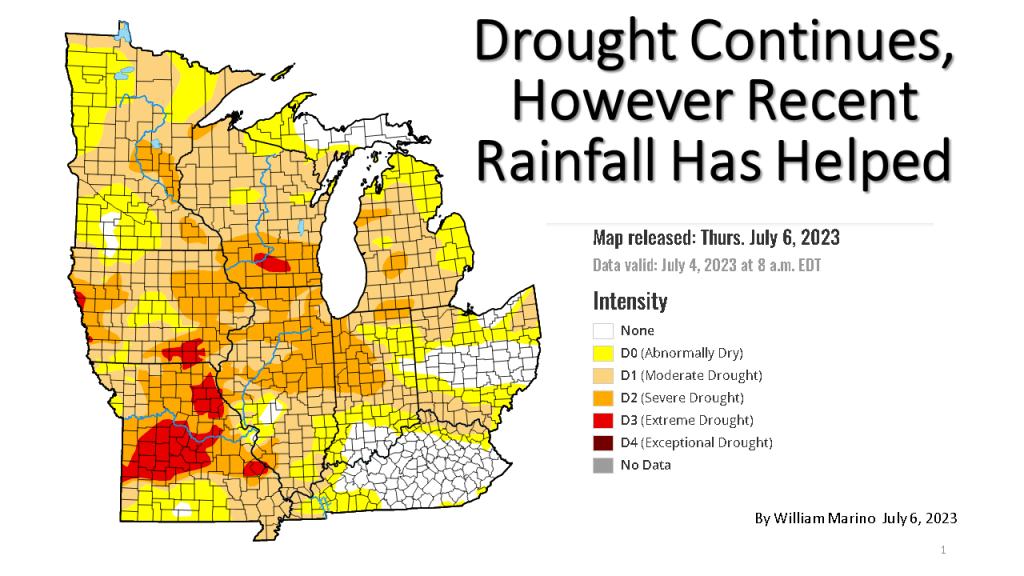
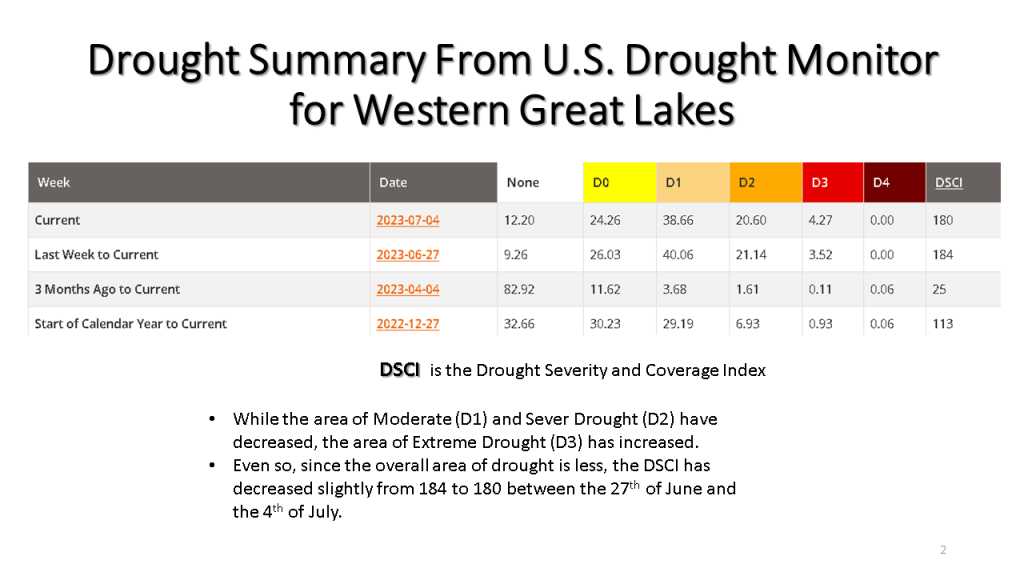
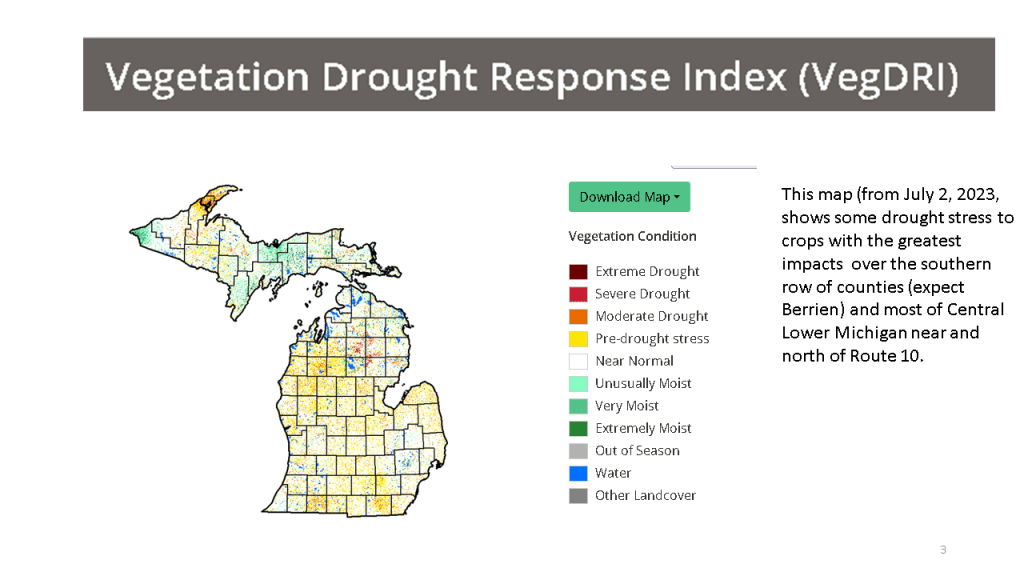


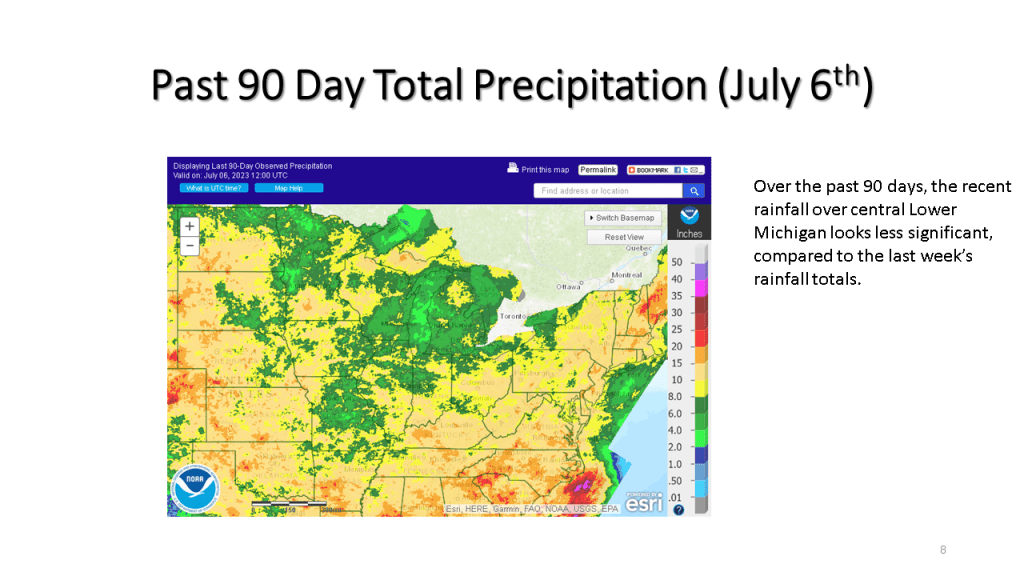
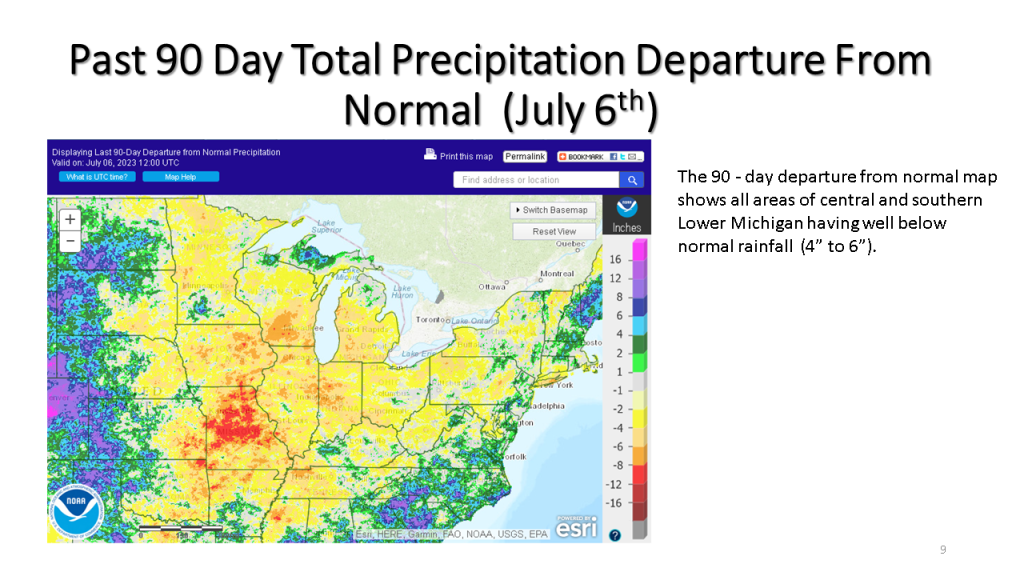
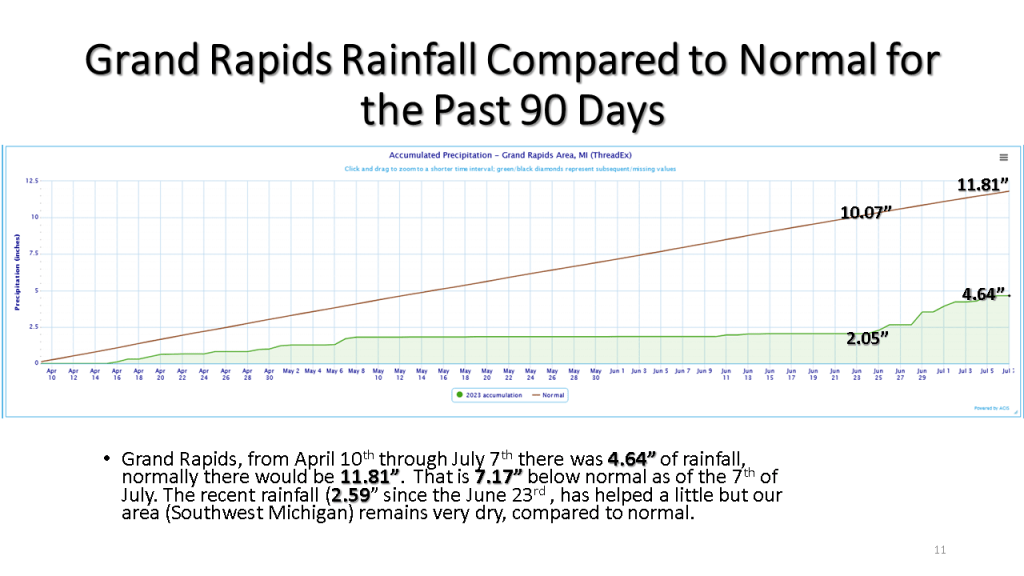
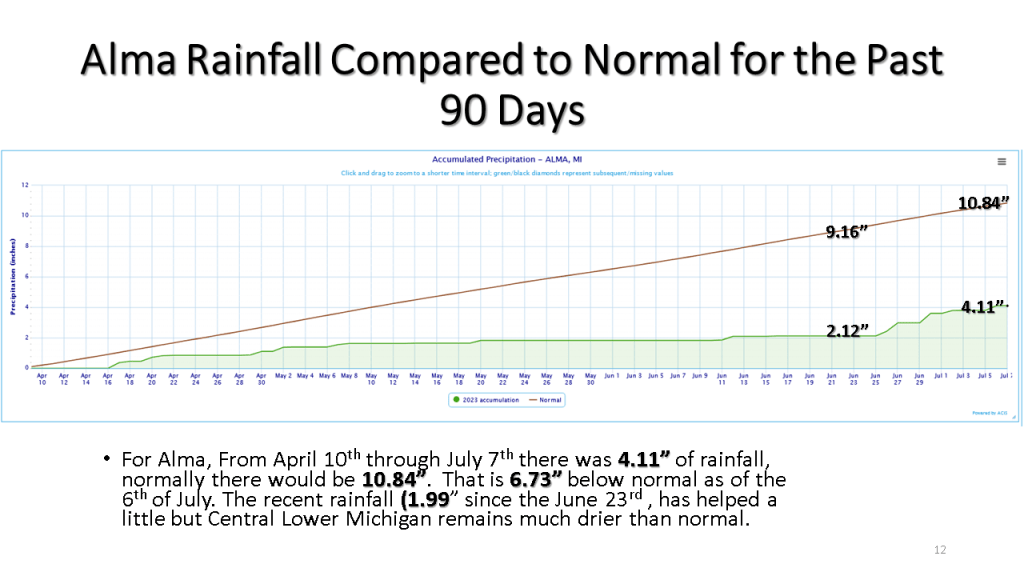
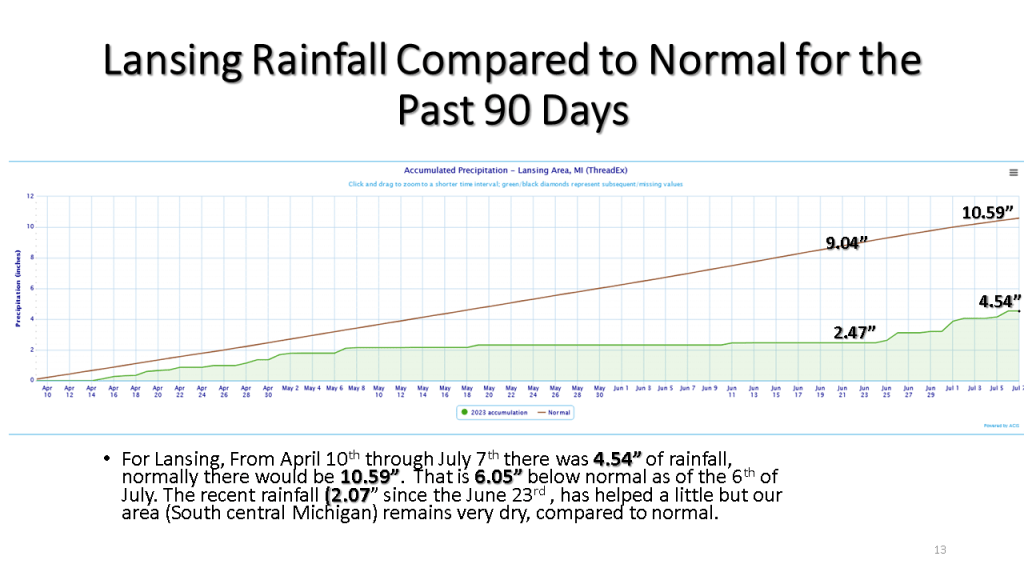
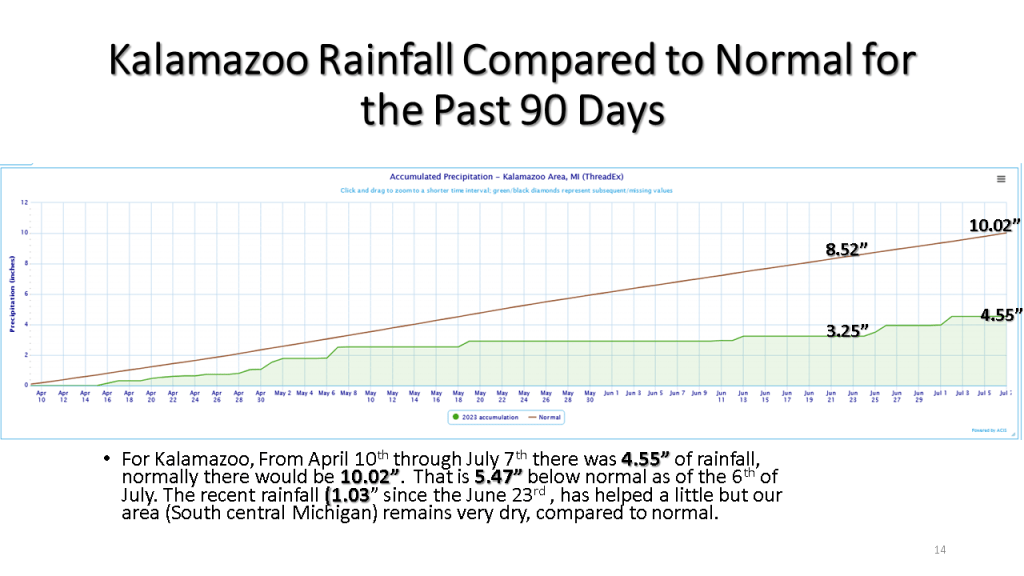
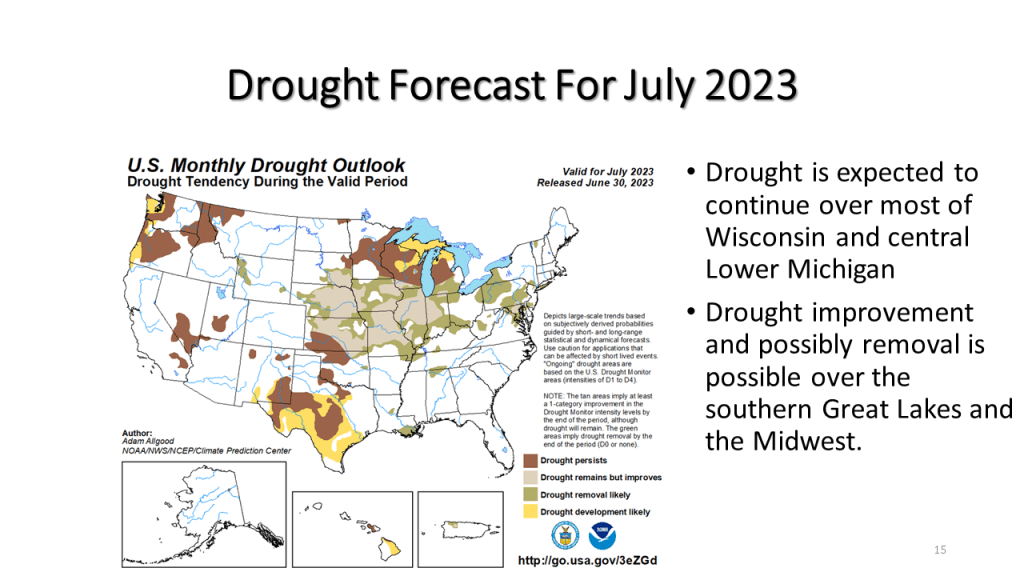

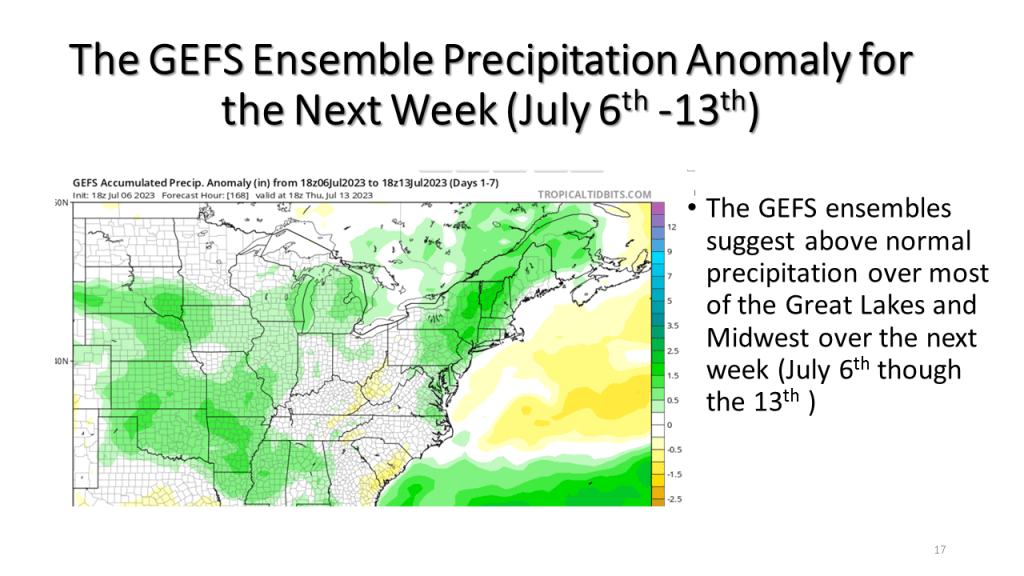
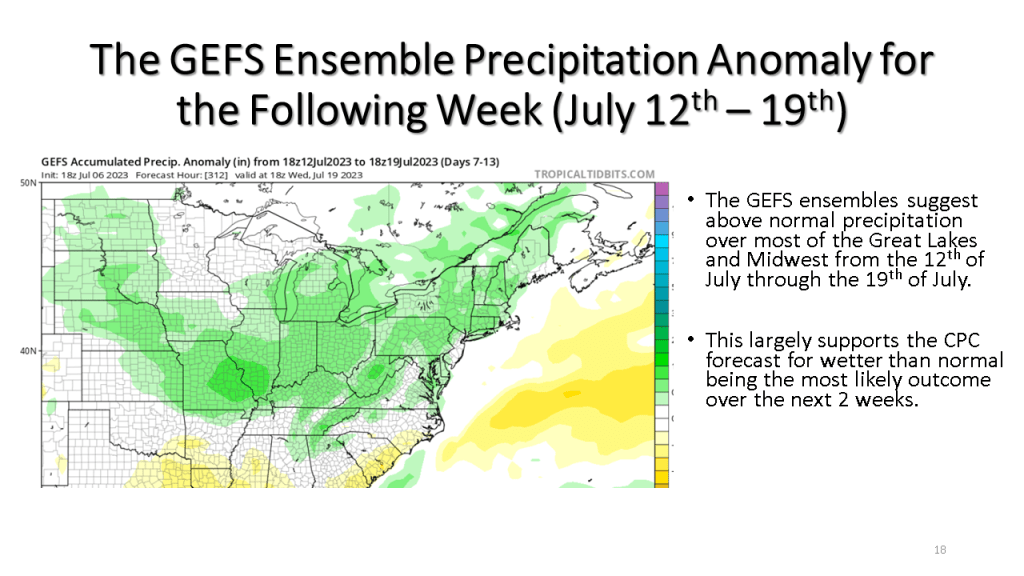
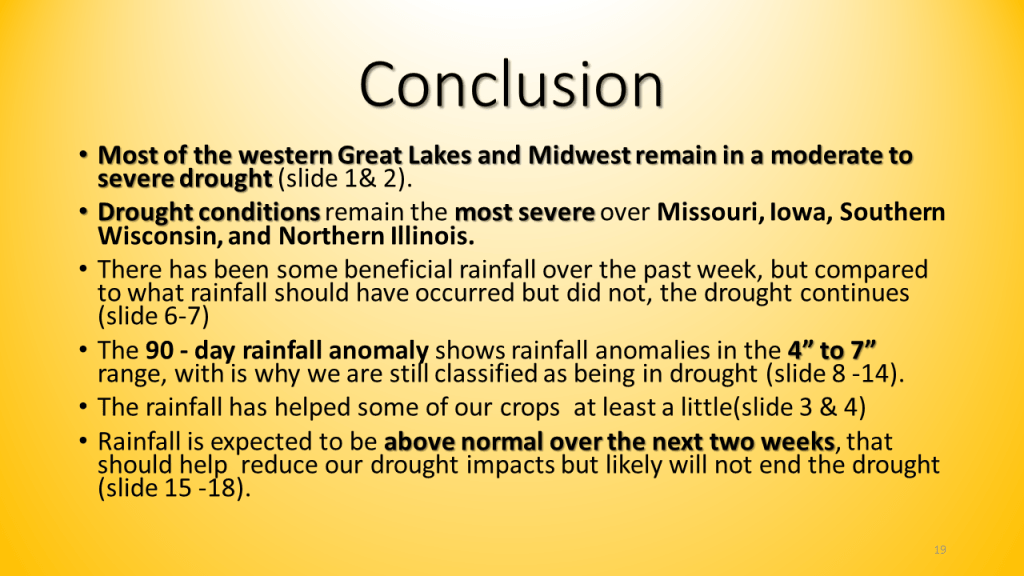
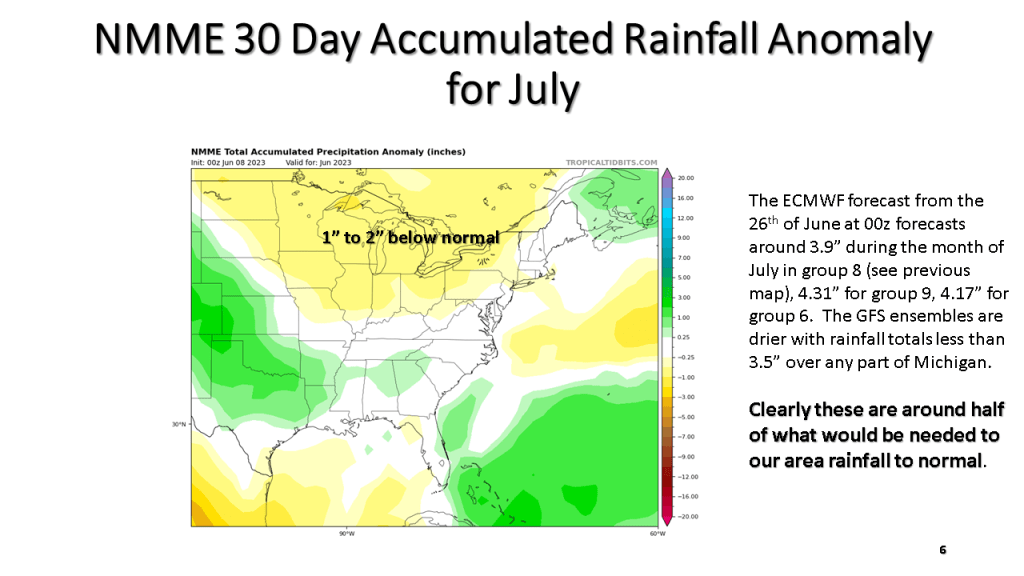
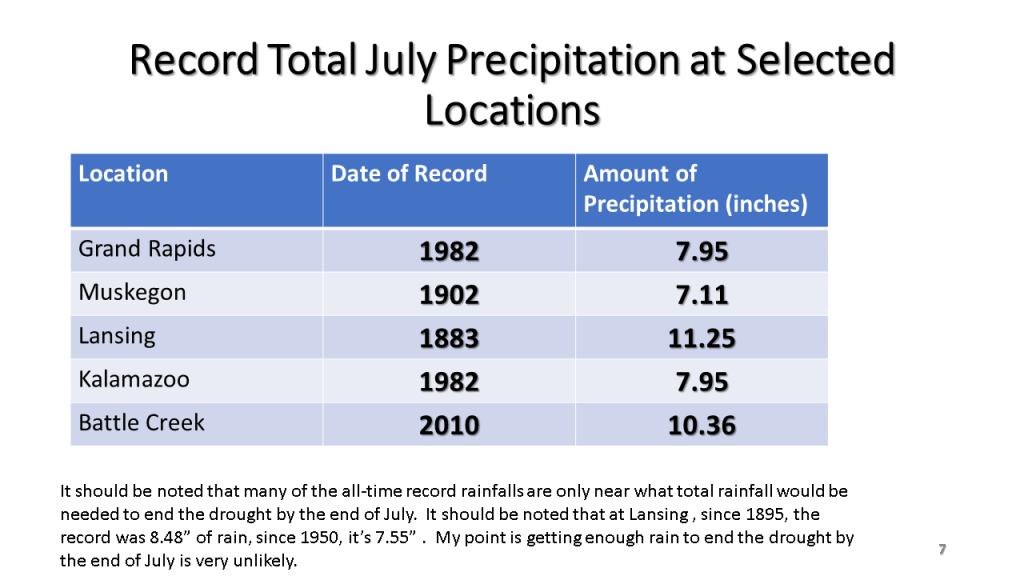
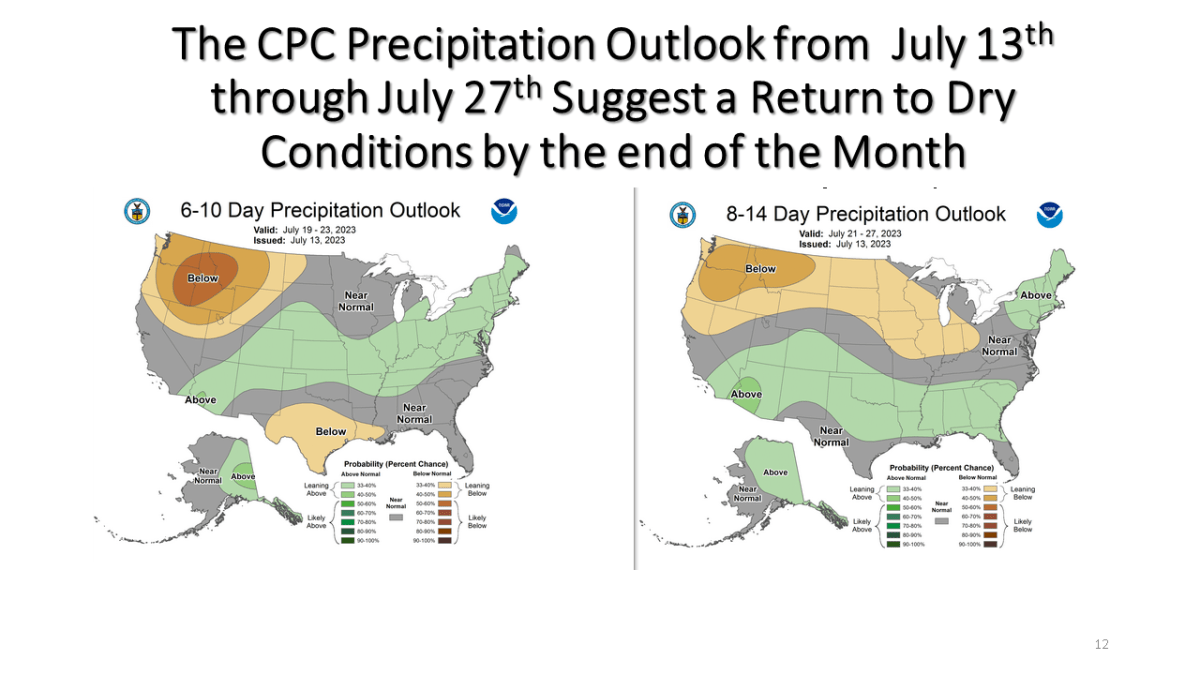
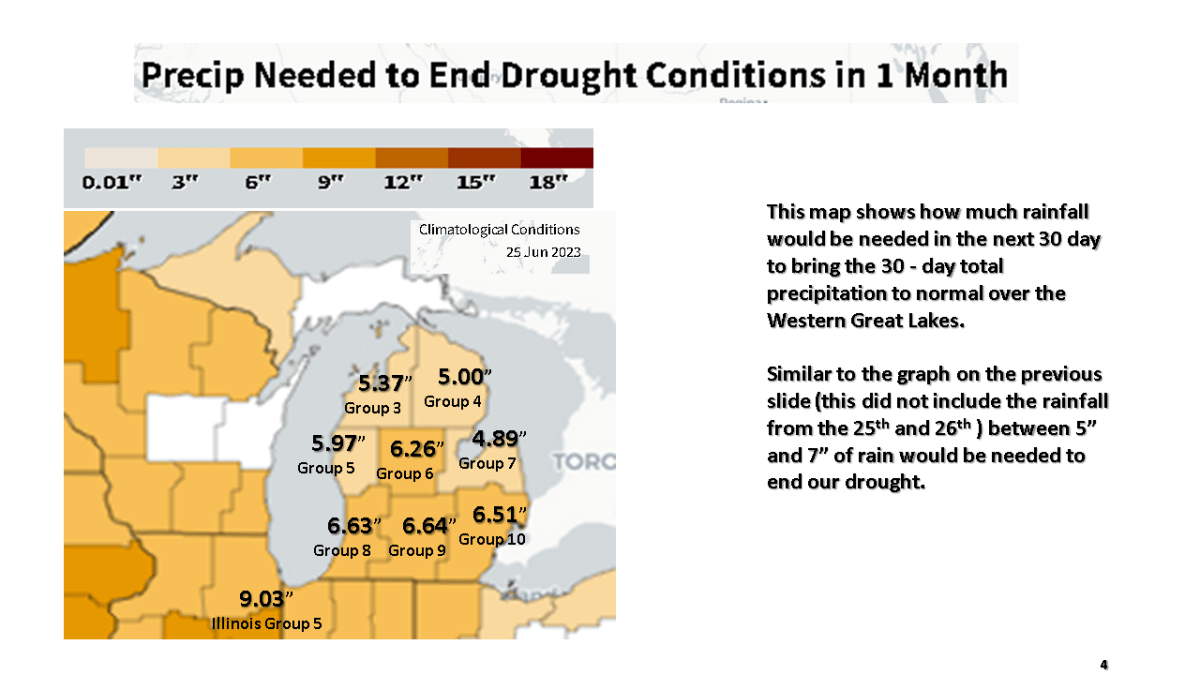
To end our current drought over southern Michigan we would need around 6 inches of rain by the end of July. This is near record totals for July at most of our climate sites. It would seem unlikely given our current weather pattern we would get that much widespread rainfall. So while we do expect more rain in the next month than the previous month, the expected rainfall will likely fall short of ending this drought.