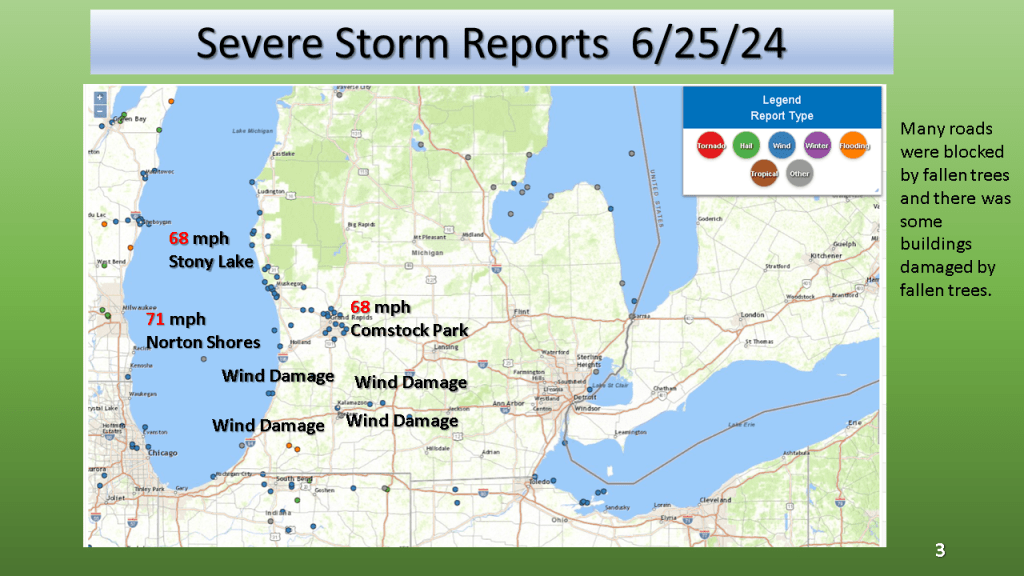
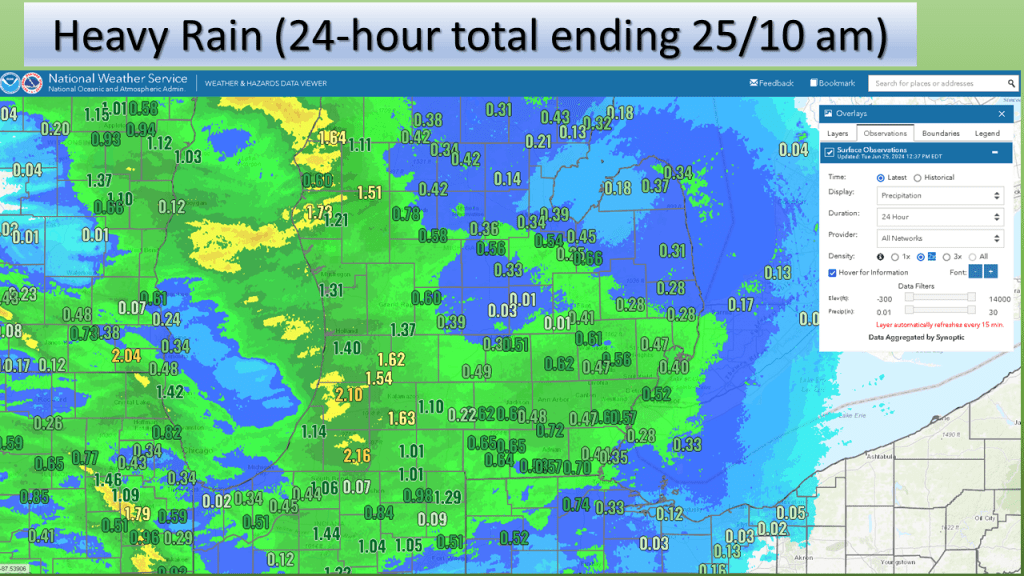
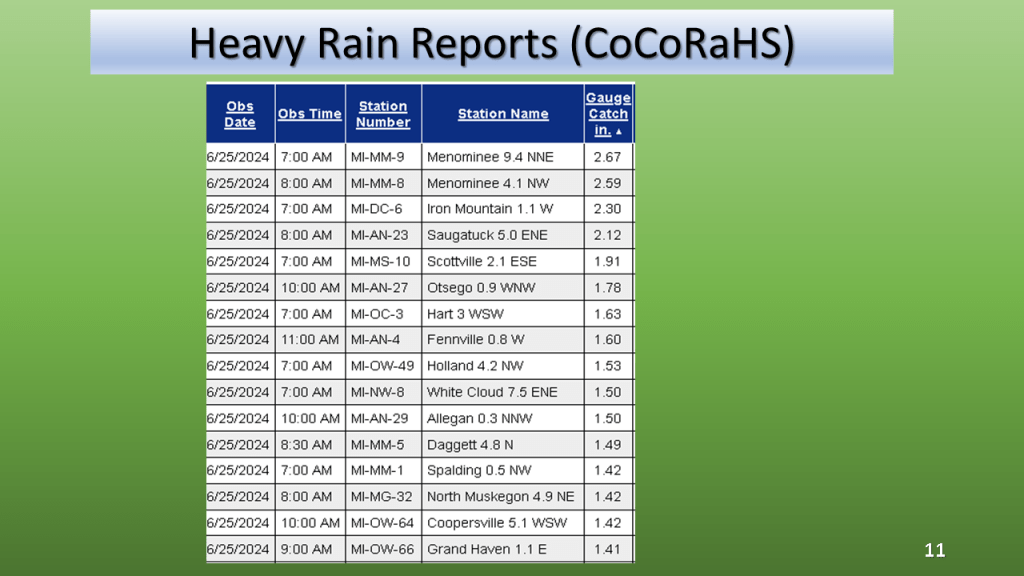
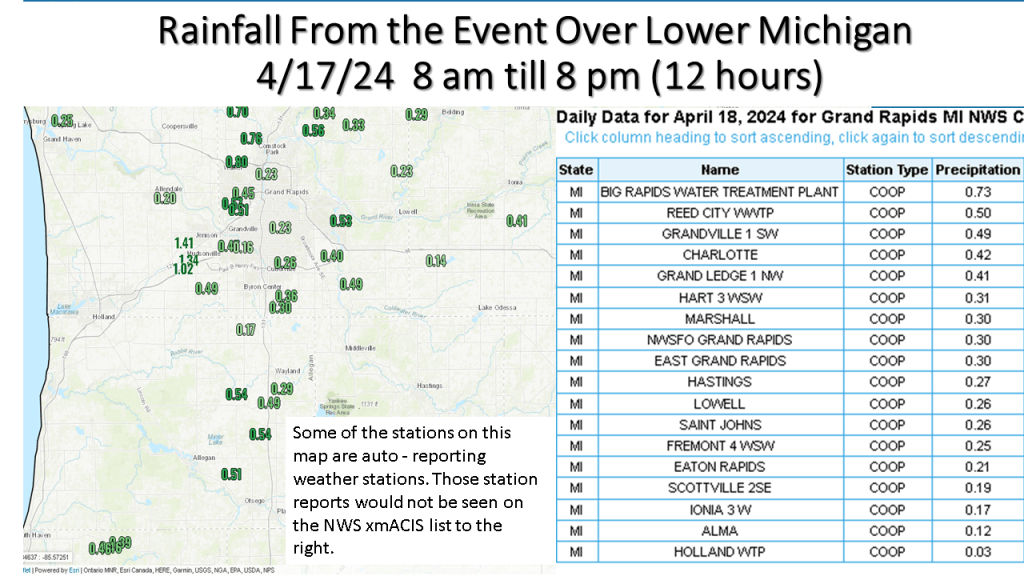
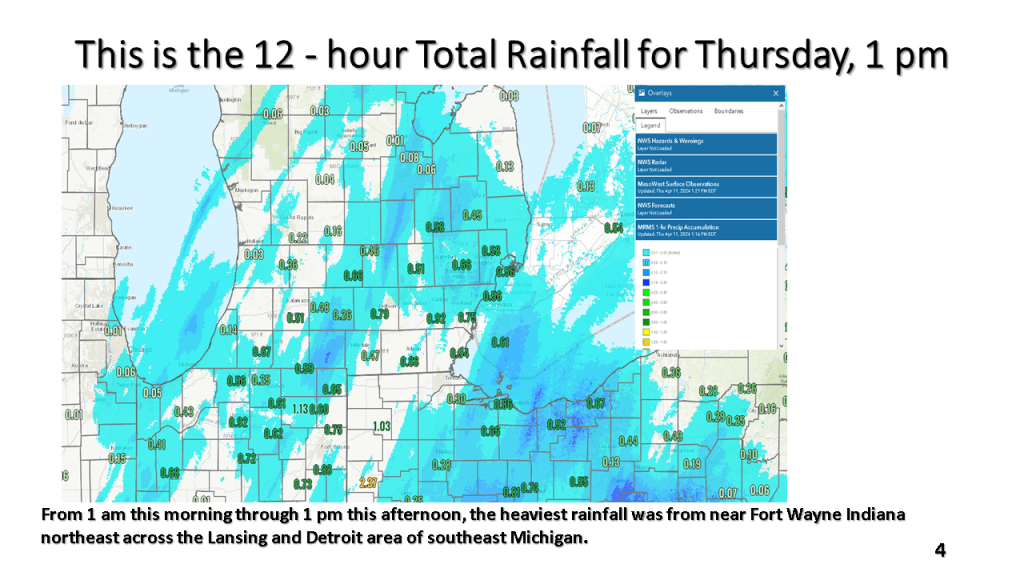
Thunderstorms with heavy rain two nights in a row brought 2″ to 3″ of rain over a good share of southern Half of Lower Michigan.

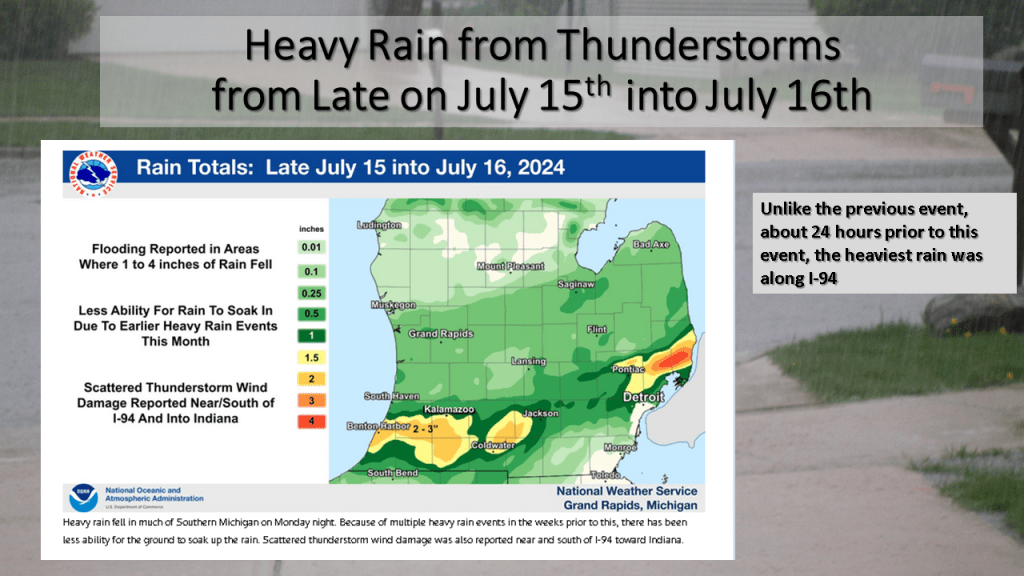

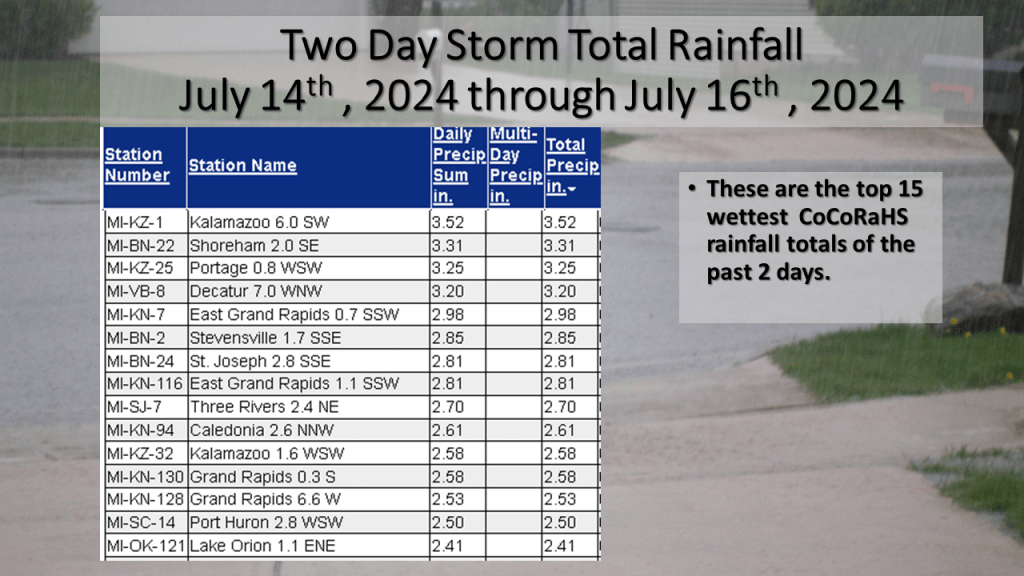
Kalamazoo’s CoCoRaHS report of 3.52″ was the greatest total from the reports I have seen.
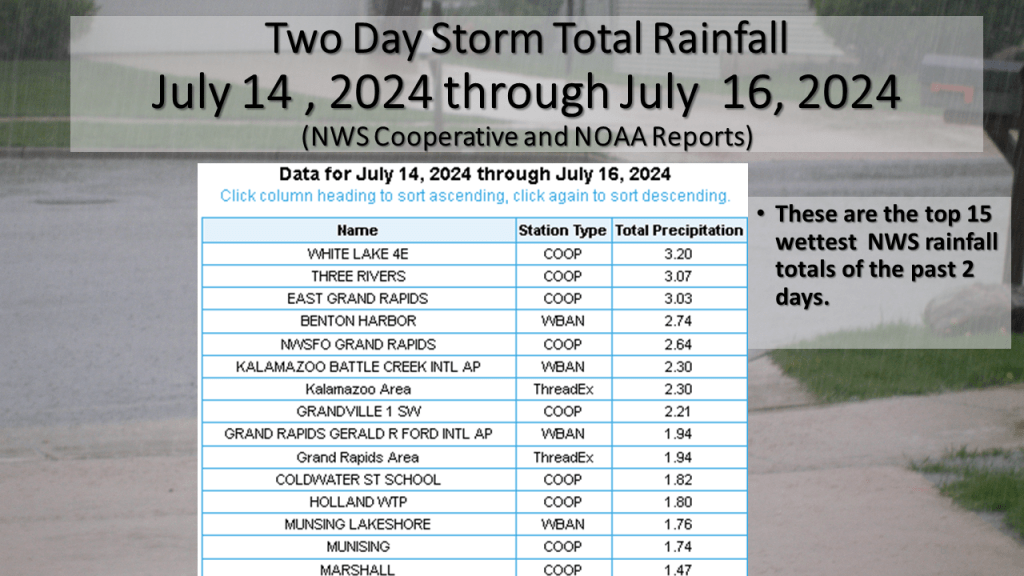
Thunderstorms with heavy rain two nights in a row brought 2″ to 3″ of rain over a good share of southern Half of Lower Michigan.
Kalamazoo’s CoCoRaHS report of 3.52″ was the greatest total from the reports I have seen.
National Weather Service / Grand Rapids Storm Summary
This summary has radar loops, pictures of the damage and much more!


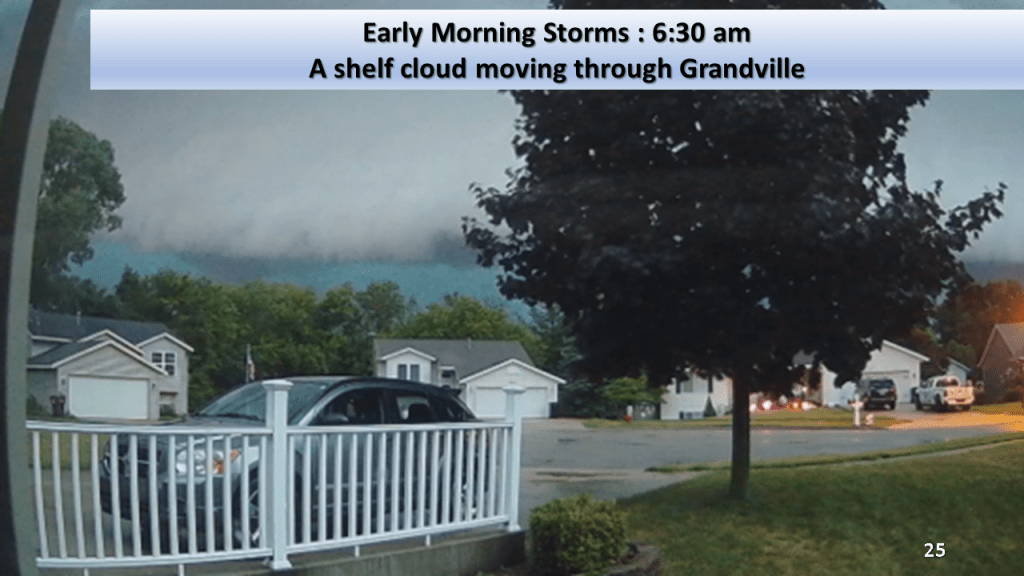
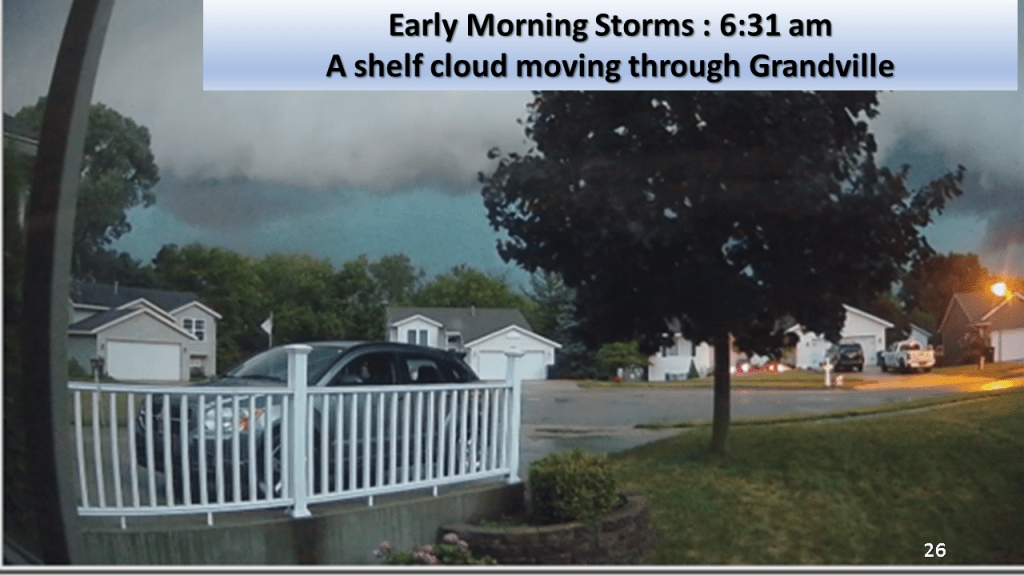

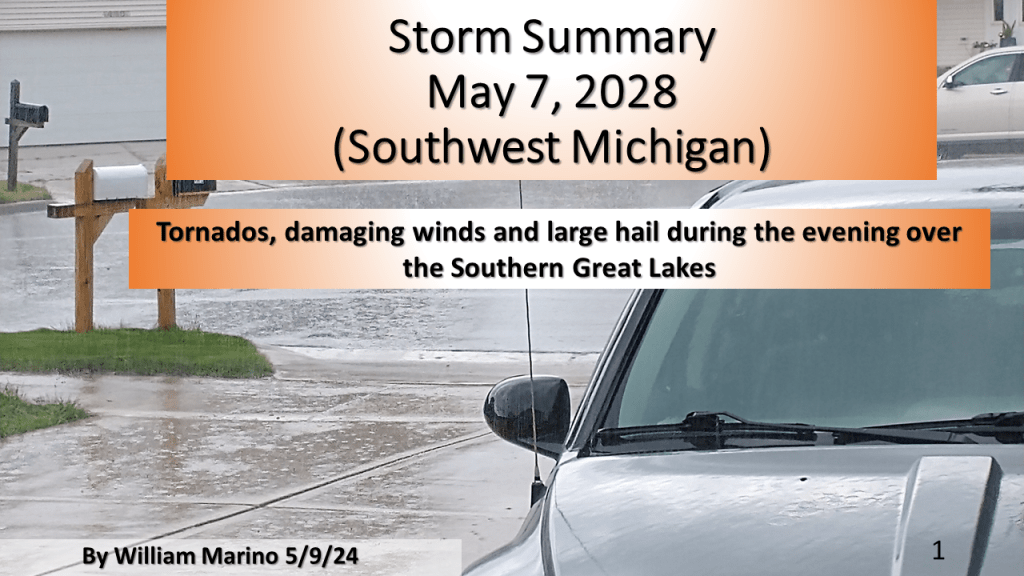
The Southern Great Lakes several tornadoes (2 EF-2), more than a dozen reports of hail larger than 2″, damaging winds, and locally heavy rainfall during the evening of Tuesday May 7th, 2024.

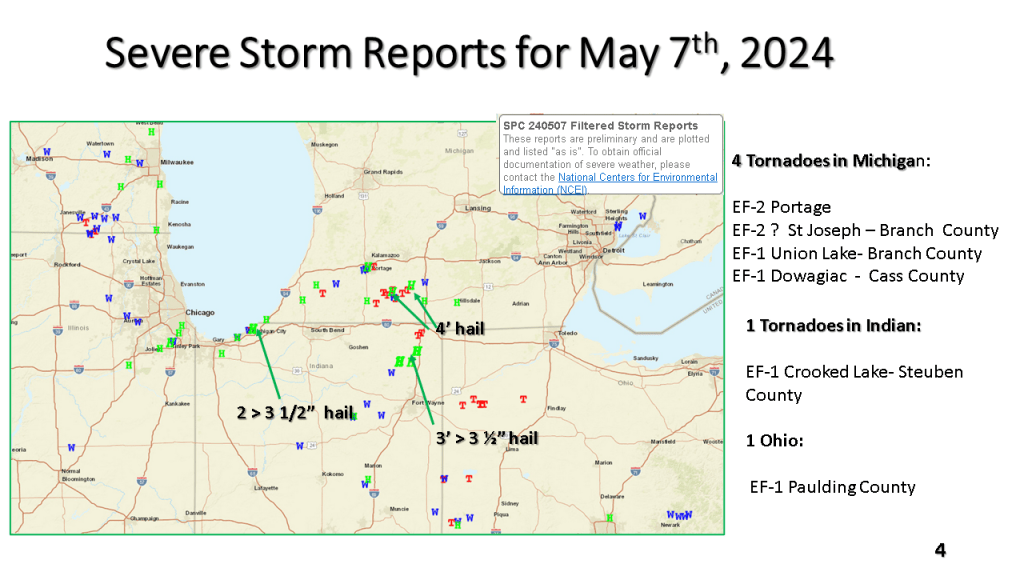


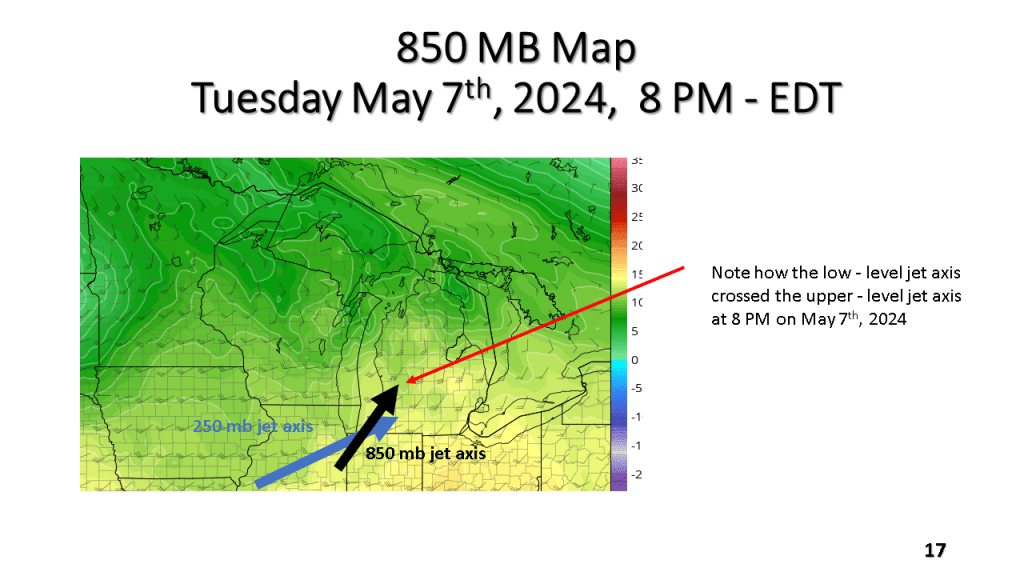
(Severe reports were mostly large hail near Lansing)


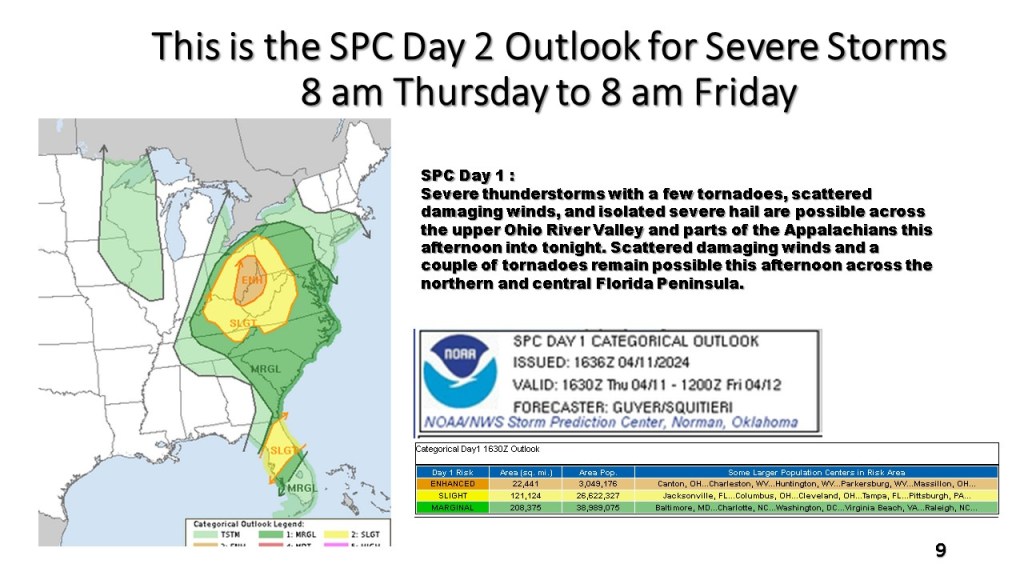


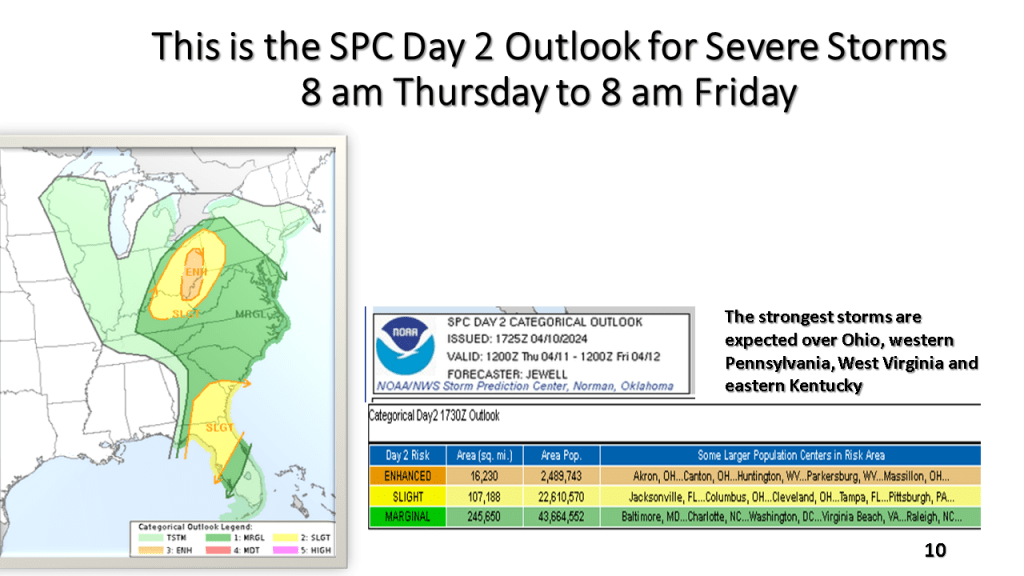
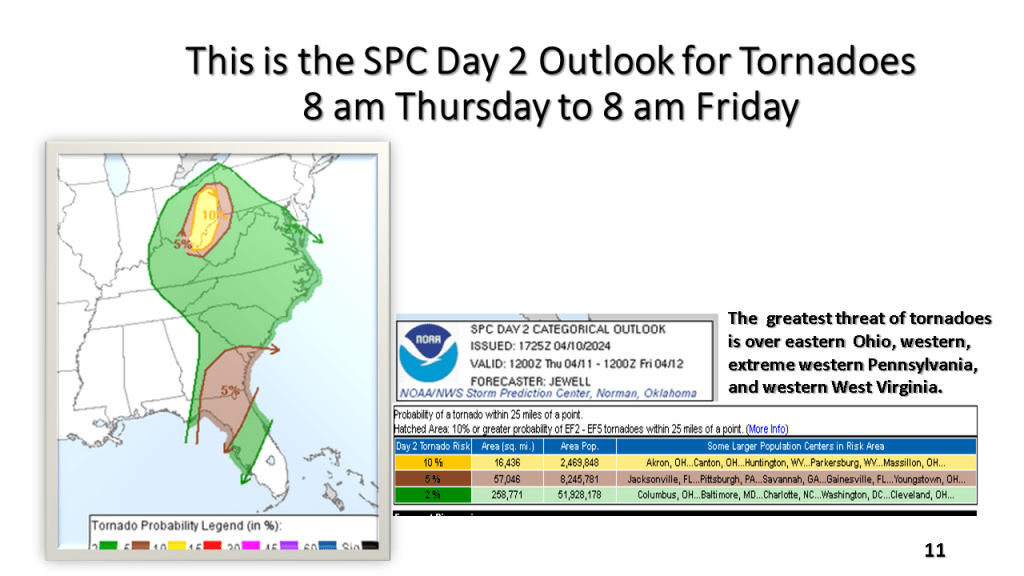
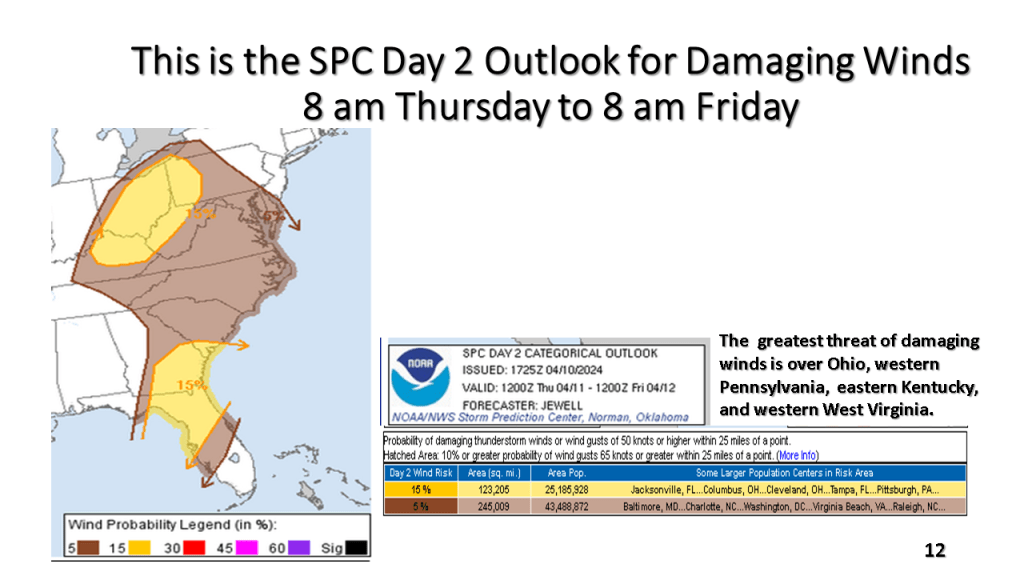
South of Michigan there is an enhanced risk for severe thunderstorms, including tornadoes over Ohio, western Pennsylvanian, West Virginia, and Kentucky.


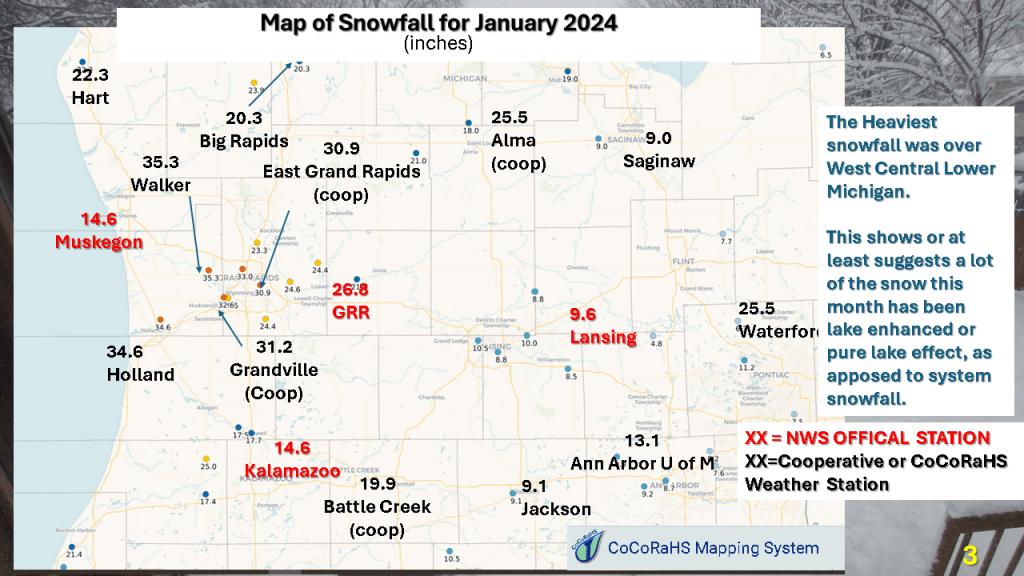
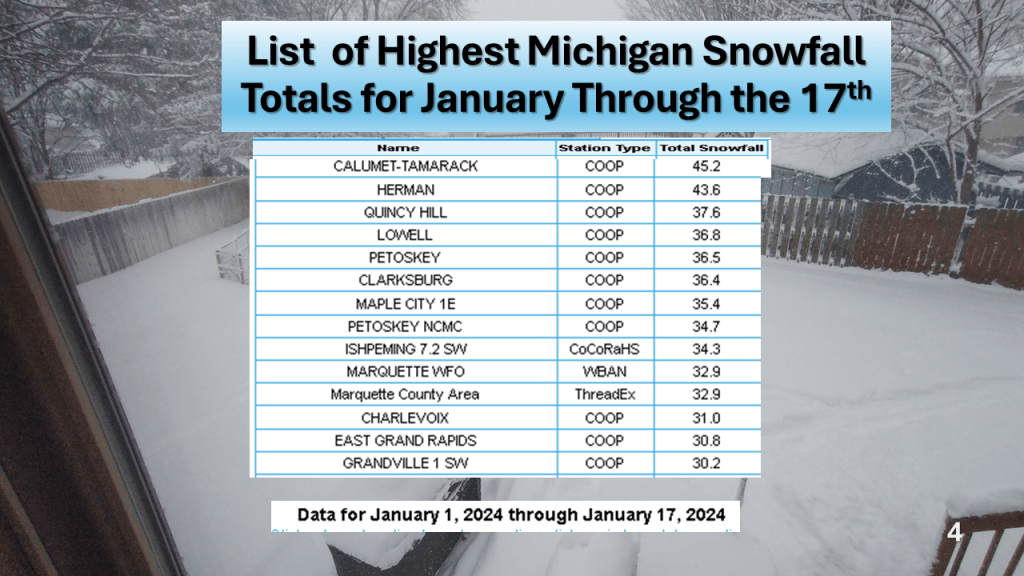
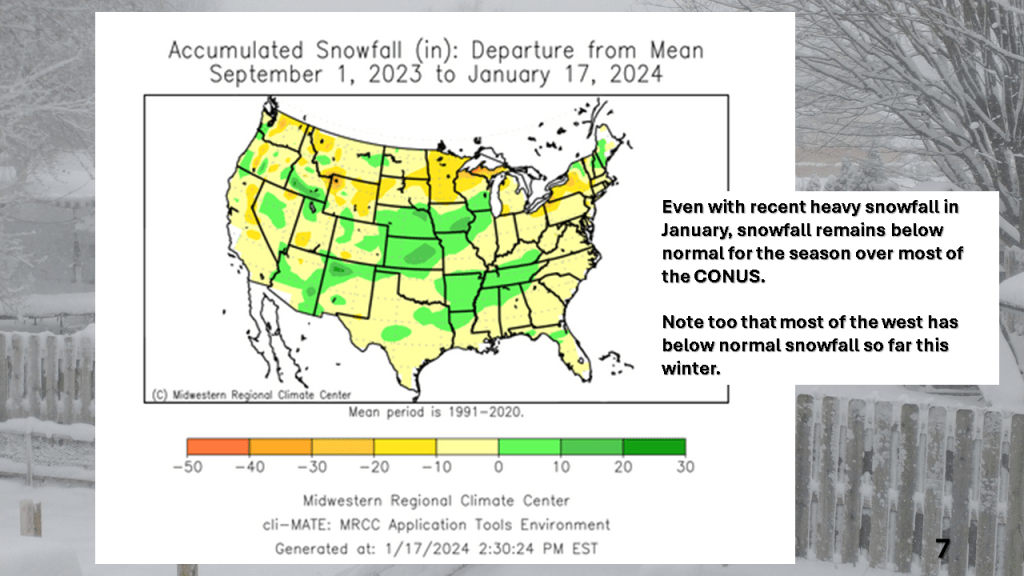
Over Michigan, November and December featured well below normal snowfall. The first 2 1/2 weeks of January seem to be making up some of that deficit. Over the rest of the CONUS, seasonal snowfall mostly remains below normal.


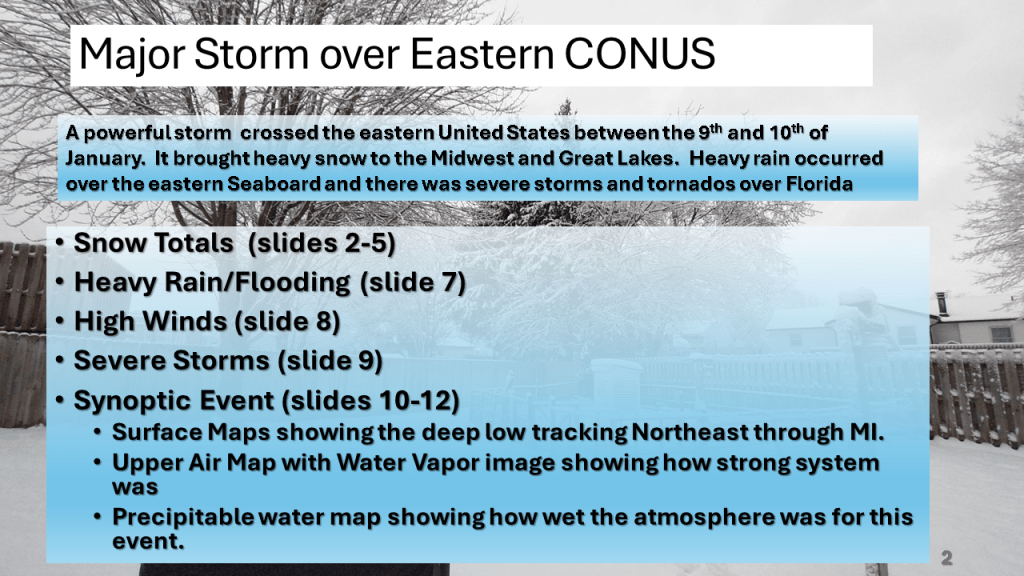
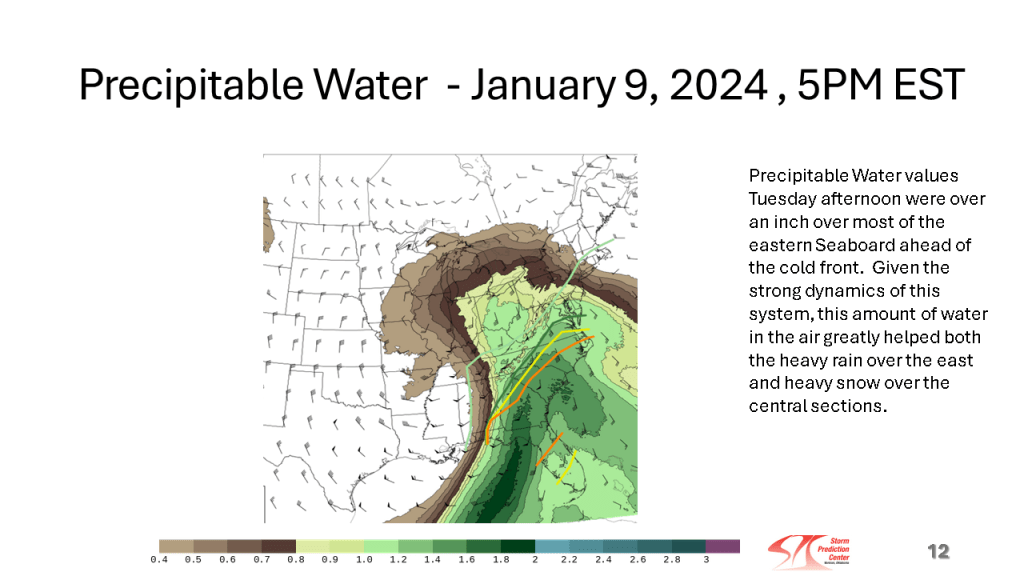
This storm brought heavy snow to the Midwest and parts of the Great Lakes, then there were damaging winds over the eastern Seaboard, as well as flooding. Severe storms and over a dozen tornadoes occurred over the Southeast sections.


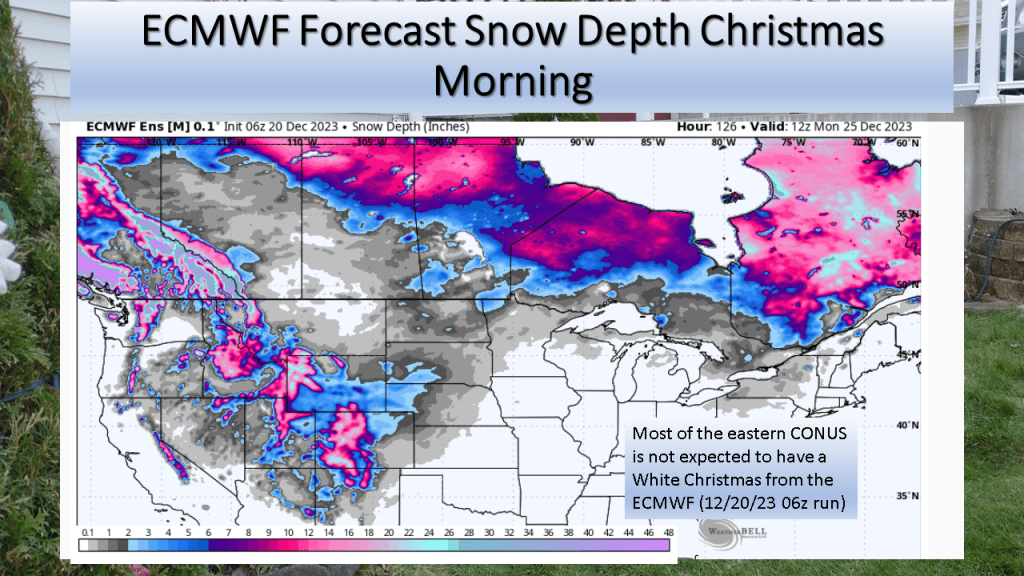
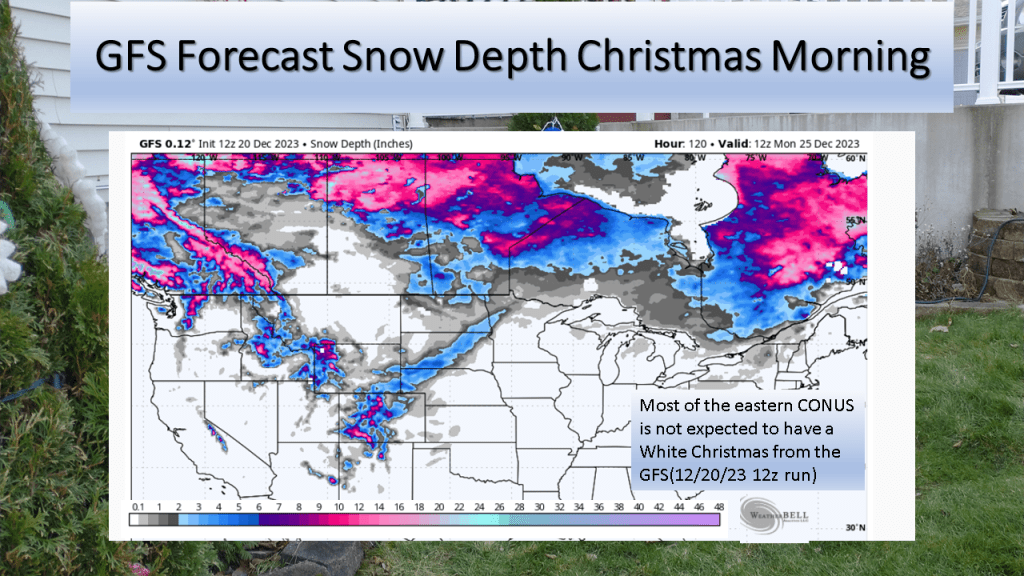
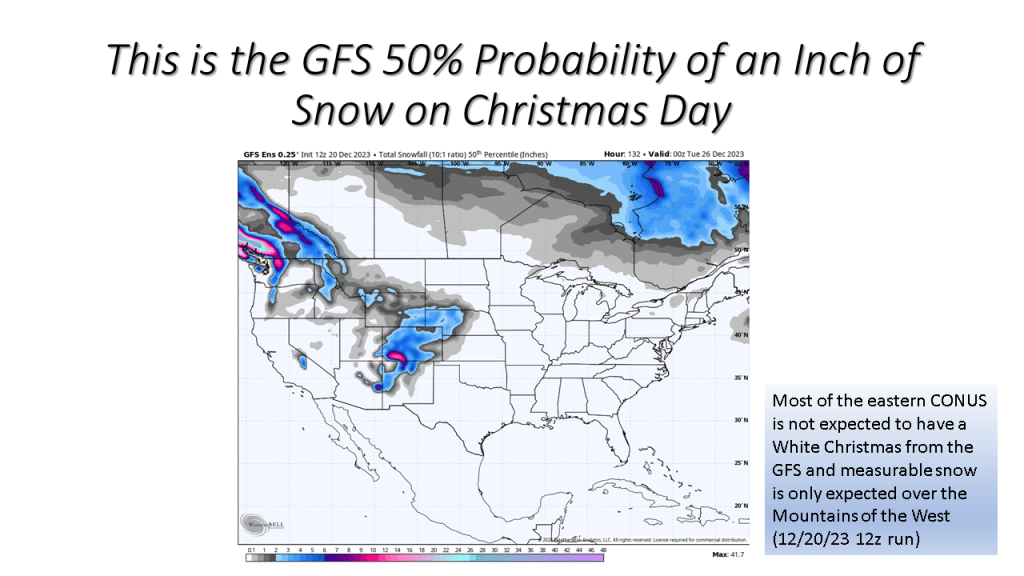
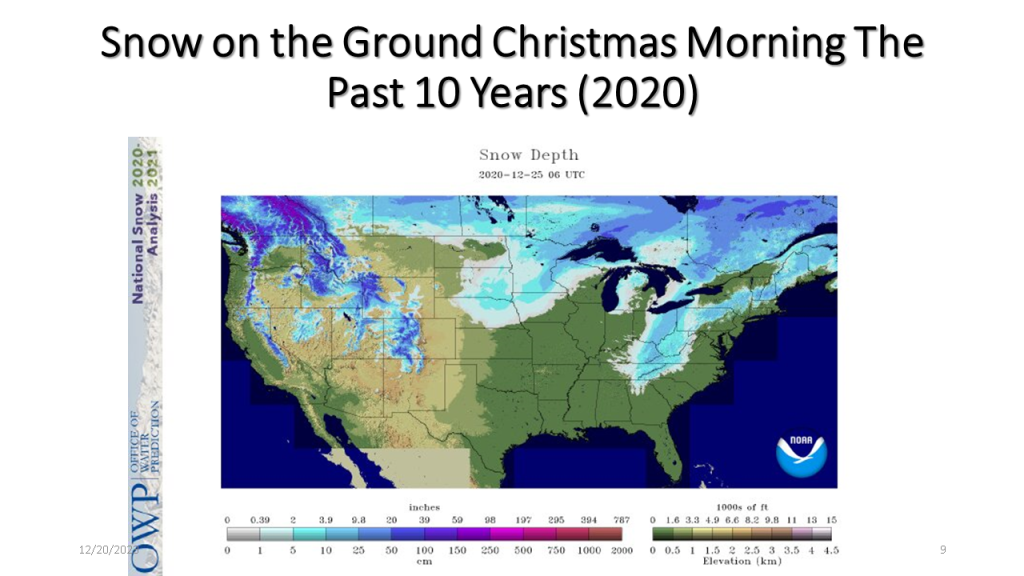
The short story is if you live in the central or eastern CONUS it is very unlikely you’ll have snow on the ground Christmas morning.
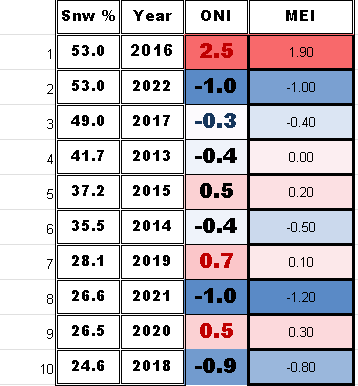
I have updated this to show the percent snow cover and ENSO state for each of the 10 years. At the end I have 2 tables that show the years with the ENSO index numbers and the snow cover for that Christmas. The bottom table sorts the percent snow cover from highest to lowest to see if there is a correlation between the ENSO state and the percent snow cover on Christmas day.


| Area Covered By Snow: | 53% |

| Area Covered By Snow: | 26.6% |
| Area Covered By Snow: | 26.5% |

| Area Covered By Snow: | 28.1% |

| Area Covered By Snow: | 24.6% |

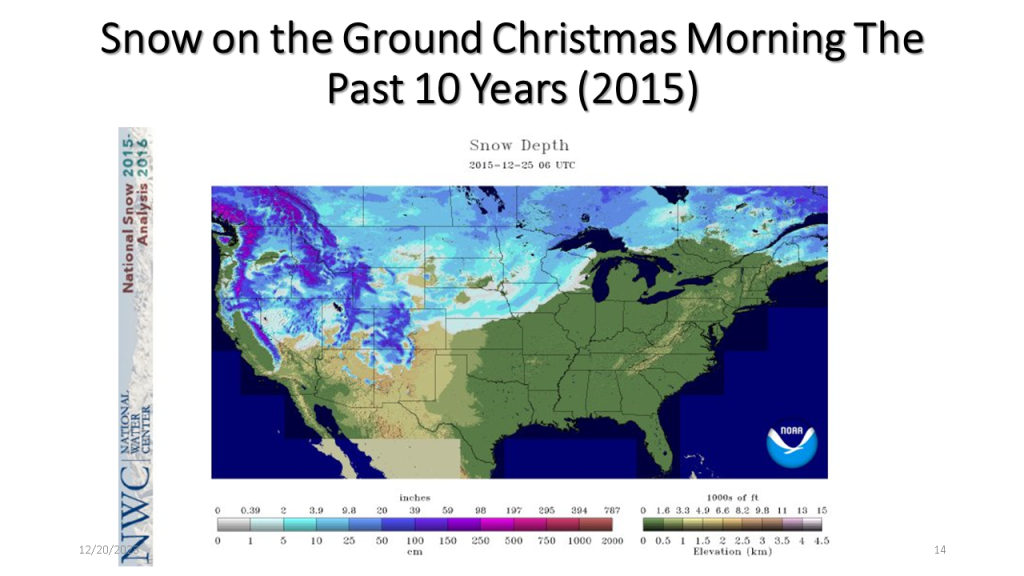
| Area Covered By Snow: | 49.0% |

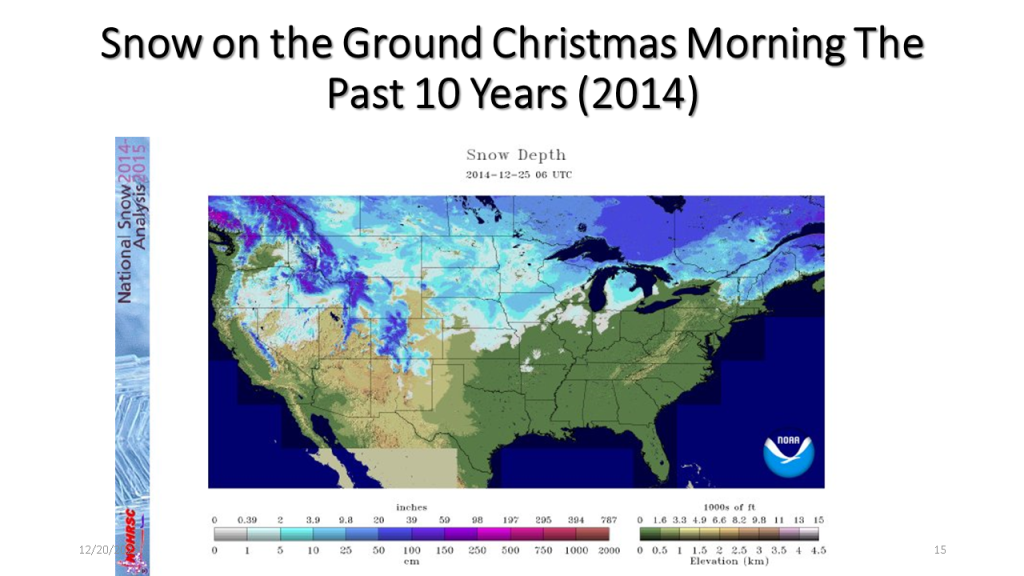
| Area Covered By Snow: | 44.1% |
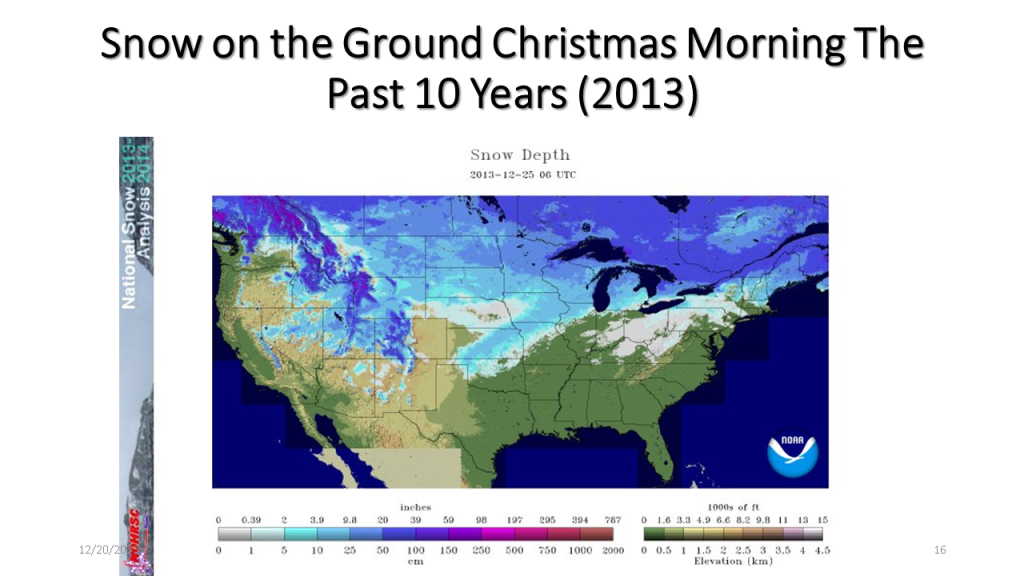
| Area Covered By Snow: | 37.2% |
| Area Covered By Snow: | 35.5% |
| Area Covered By Snow: | 41.7% |
Below is a table showing the percent snow cover on Christmas
Below is a table showing the percent snow cover on Christmas Day in chronological order.
Below is a table showing ENSO numbers and the percent snow cover on Christmas day for that year sorted from the highest percent snow cover to the lowest. There does not seem to be a significant correlation to the ENSO state and the percent snow cover on Christmas Day.
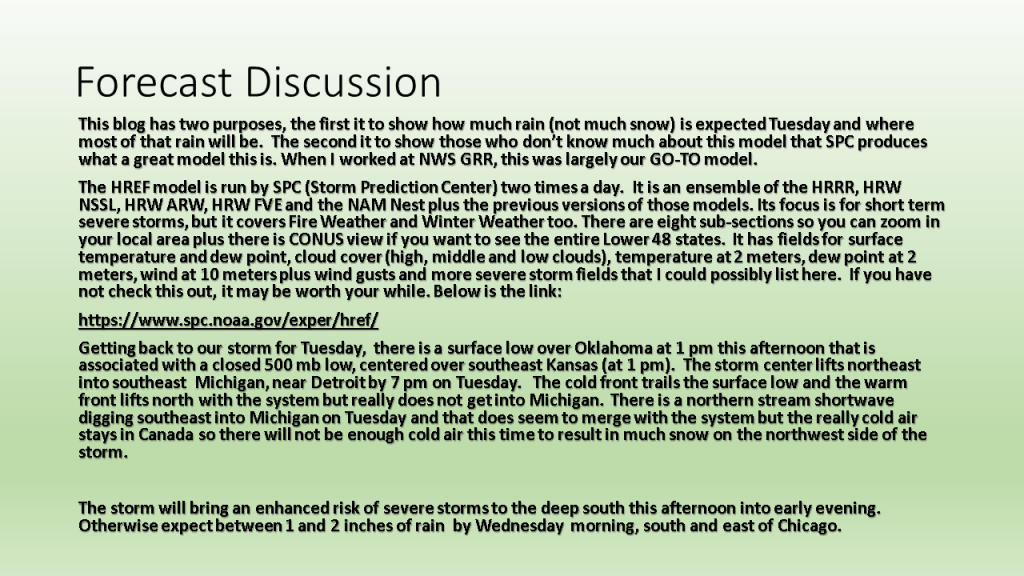
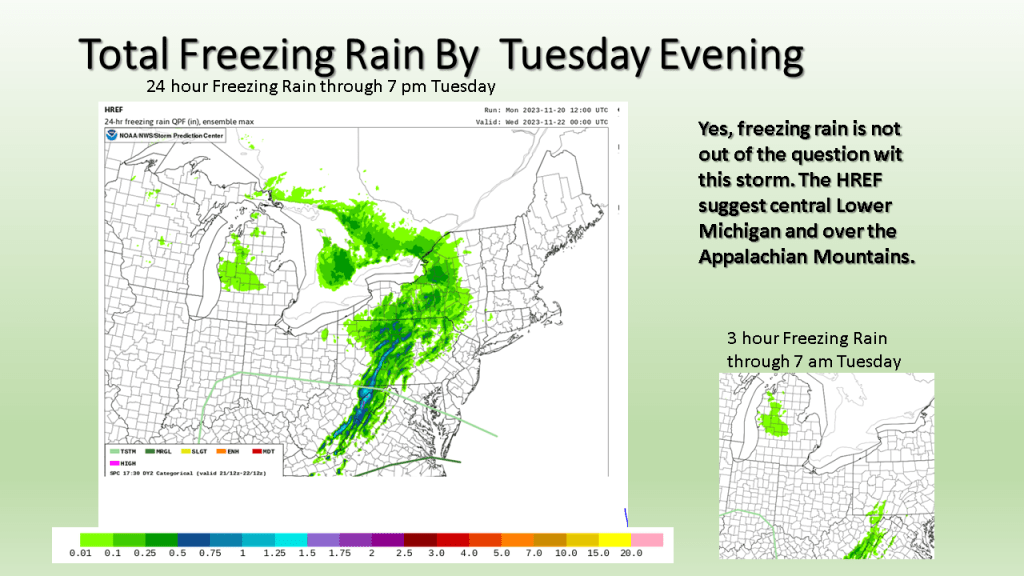
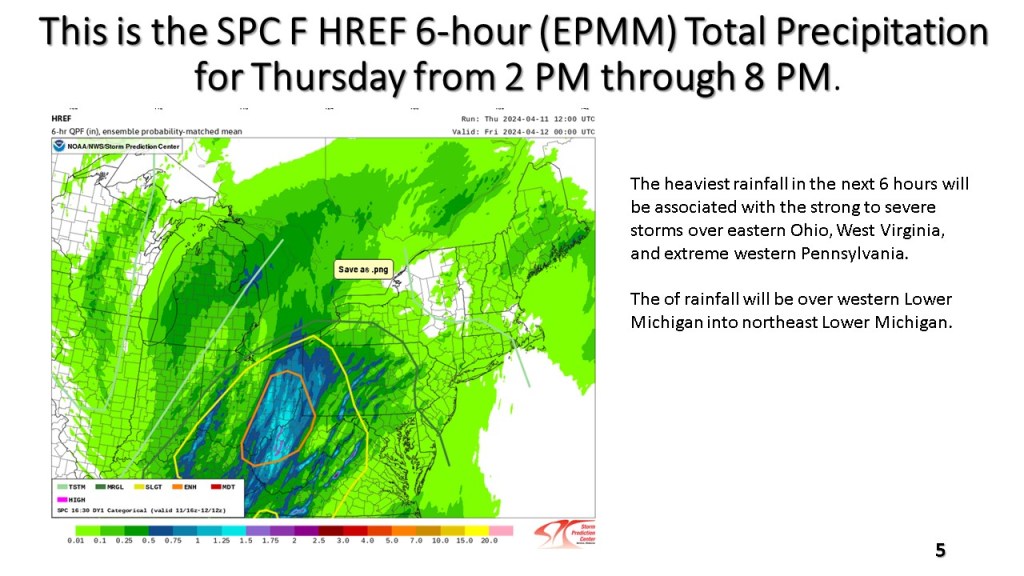
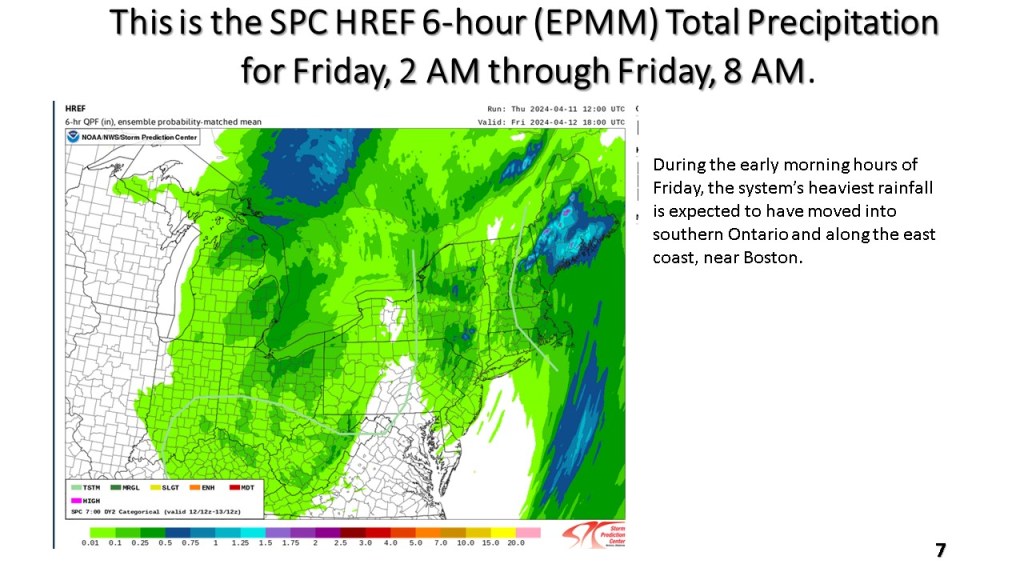
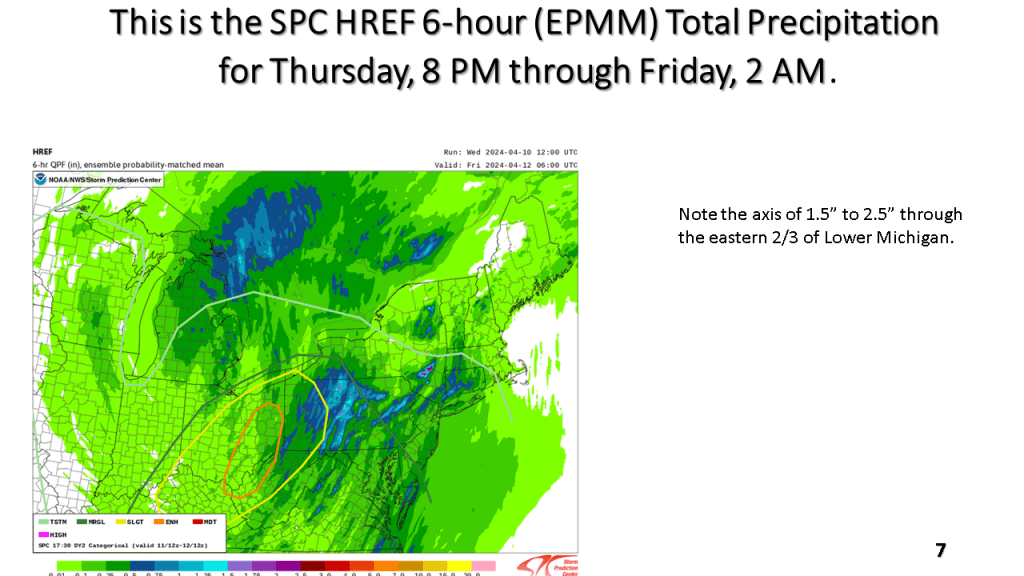
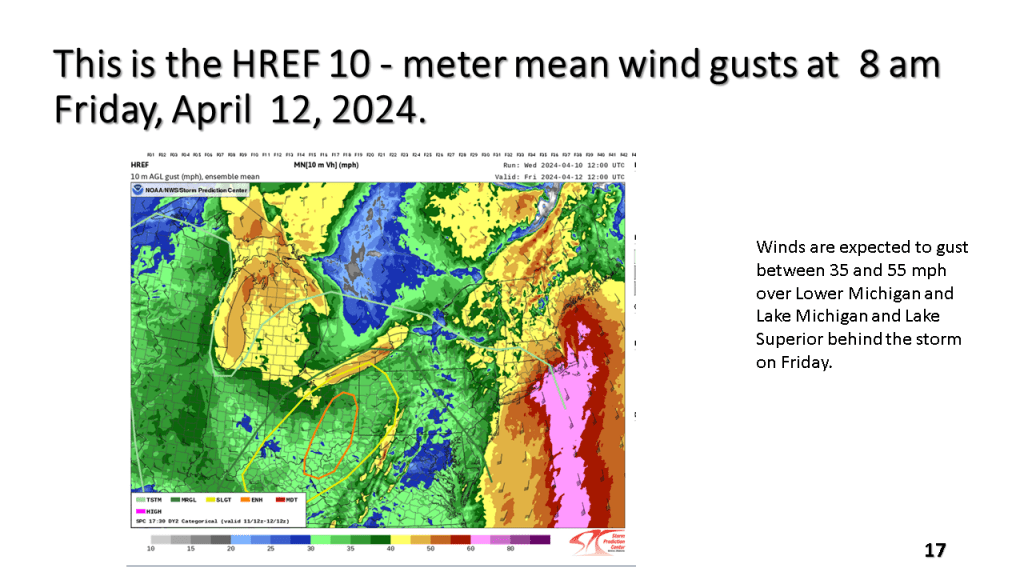
This blog is really more about showing those who do not know about the SPC HREF model. I have some of the key charts from today’s HREF that show where the severe storms are expected, the strongest winds, and heaviest rainfall.
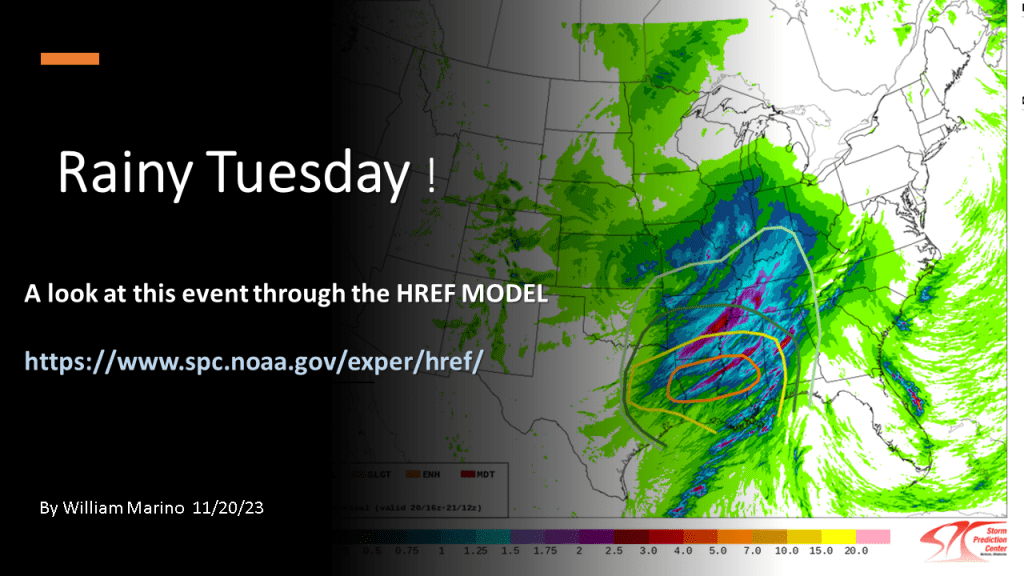
Here is a link to the SPC HREF model.