


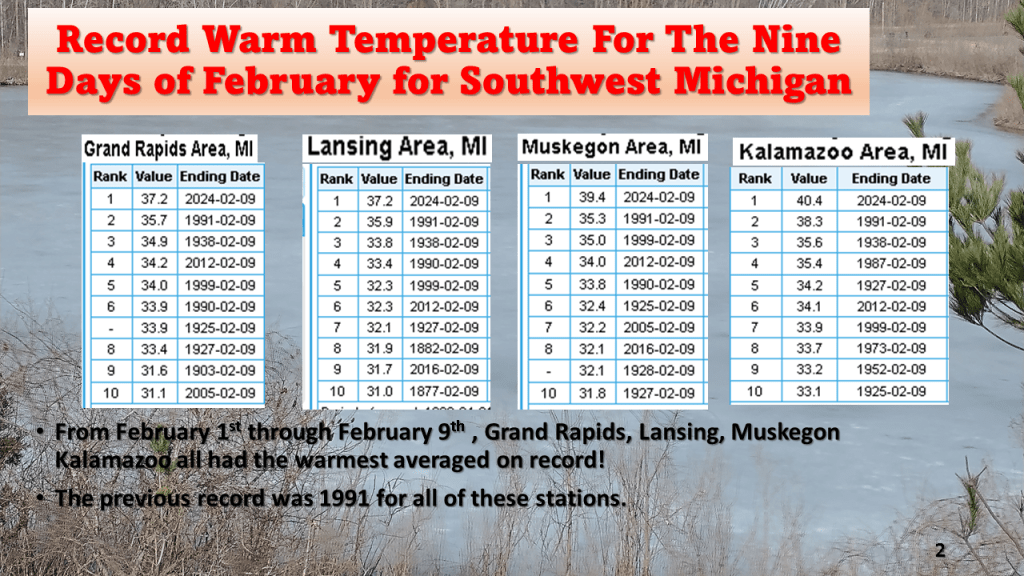
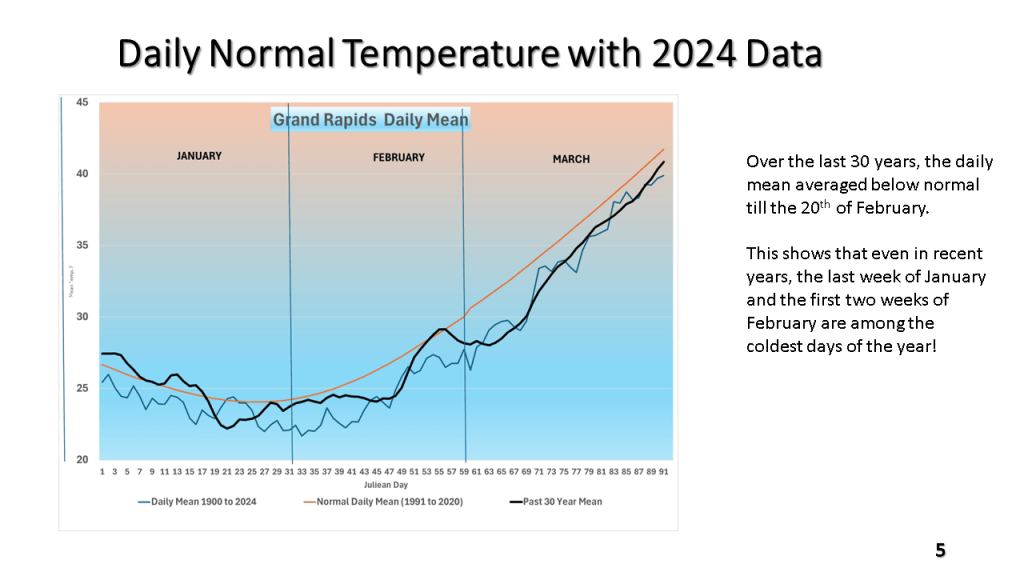
What makes this more striking is that over the past 30 years, the last week of January and the first two weeks of February are the coldest weeks of the entire year. The mean of 37.2 degrees in Grand Rapids would be normal for the 20th of March (using the 1991-2020 normal).

This past 15 days ( Jan. 23- Feb. 7) in Grand Rapids, Michigan were the warmest on record (34.8F) that exceeded the 34.7F for the 15 days ending on January 6th 2012.


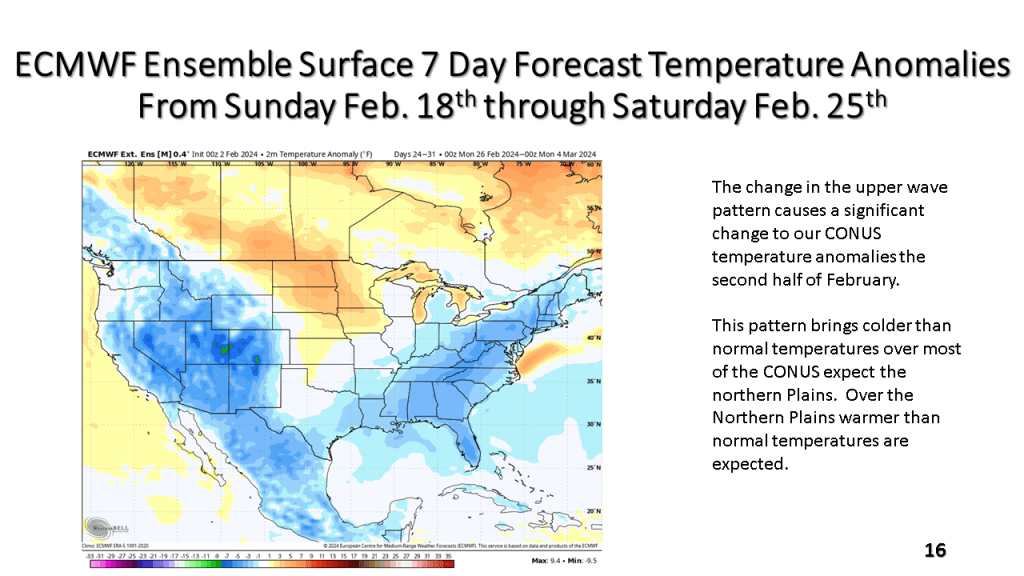


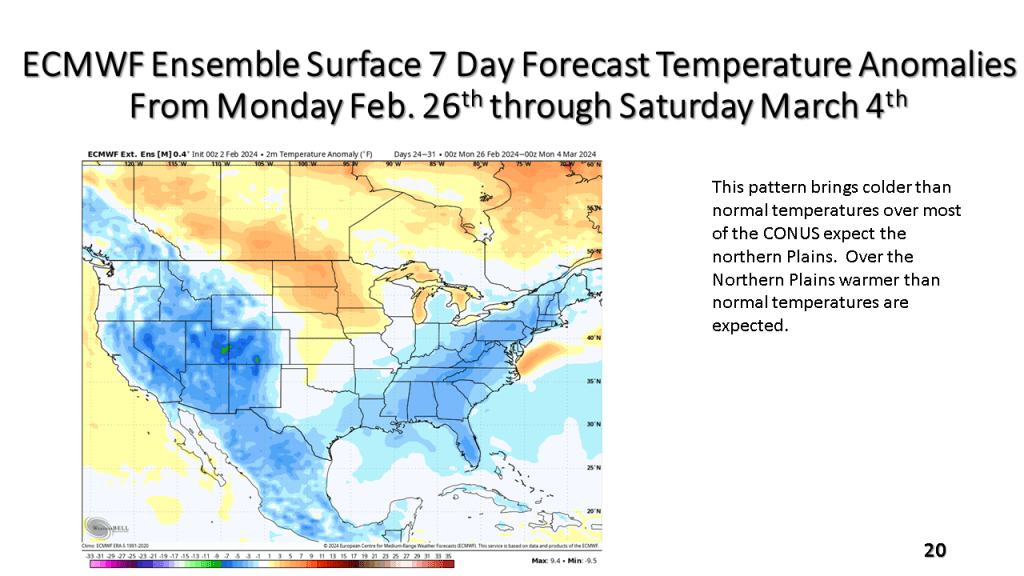
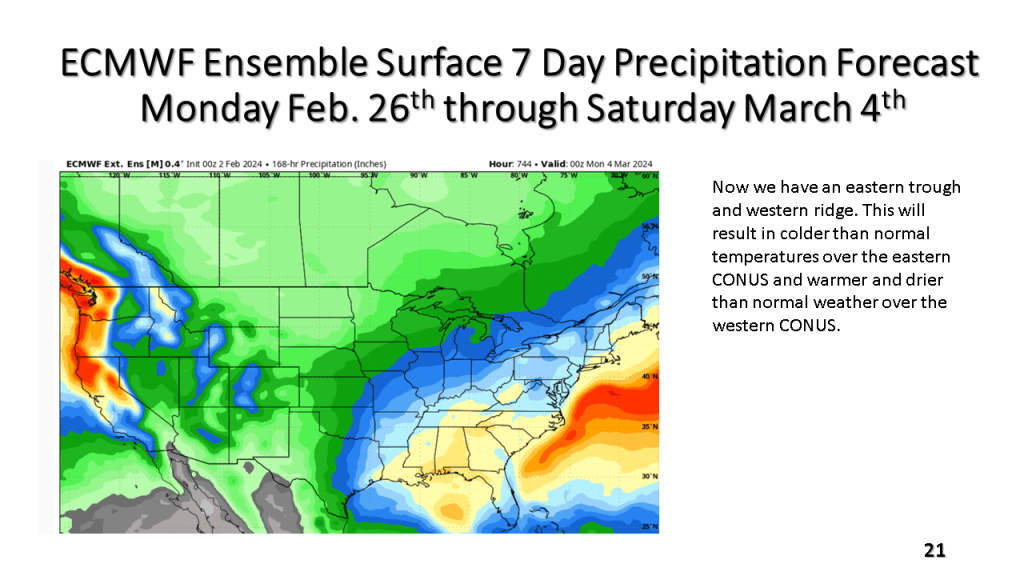


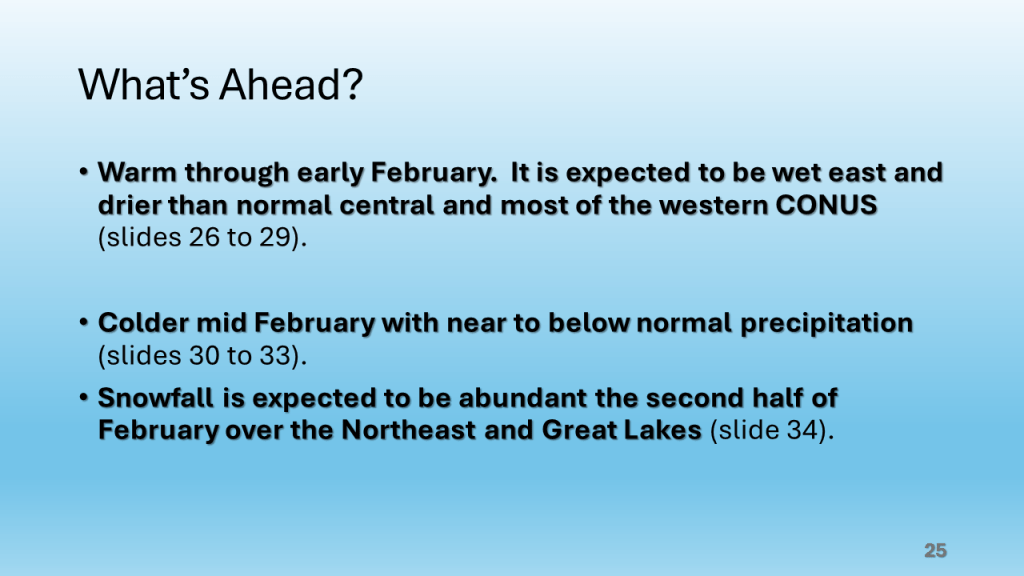
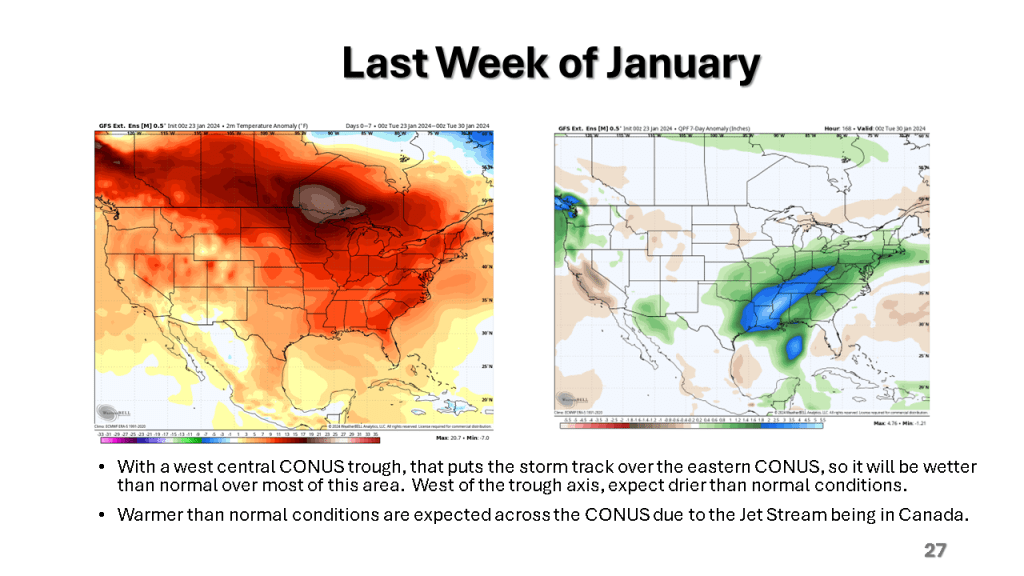
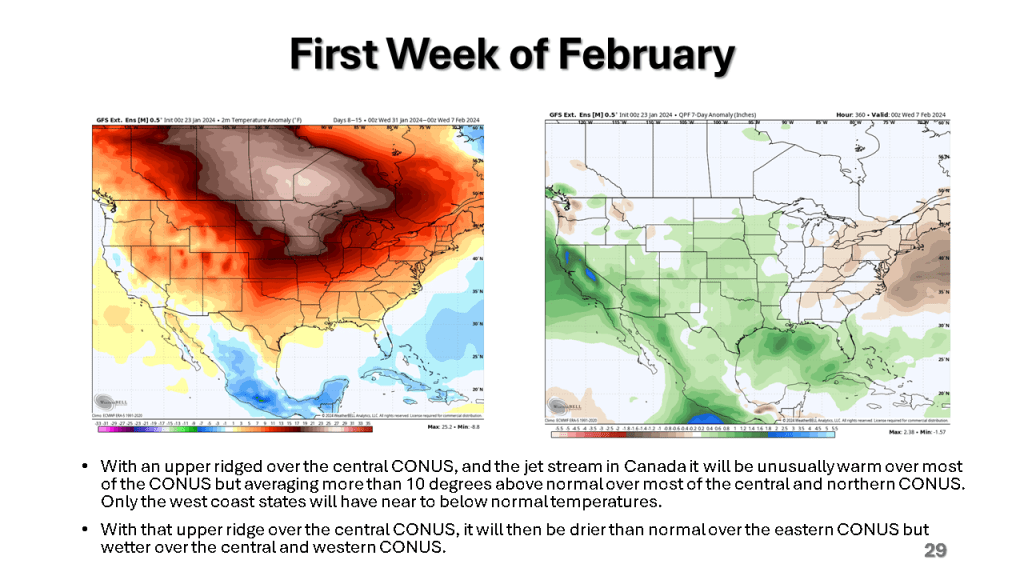
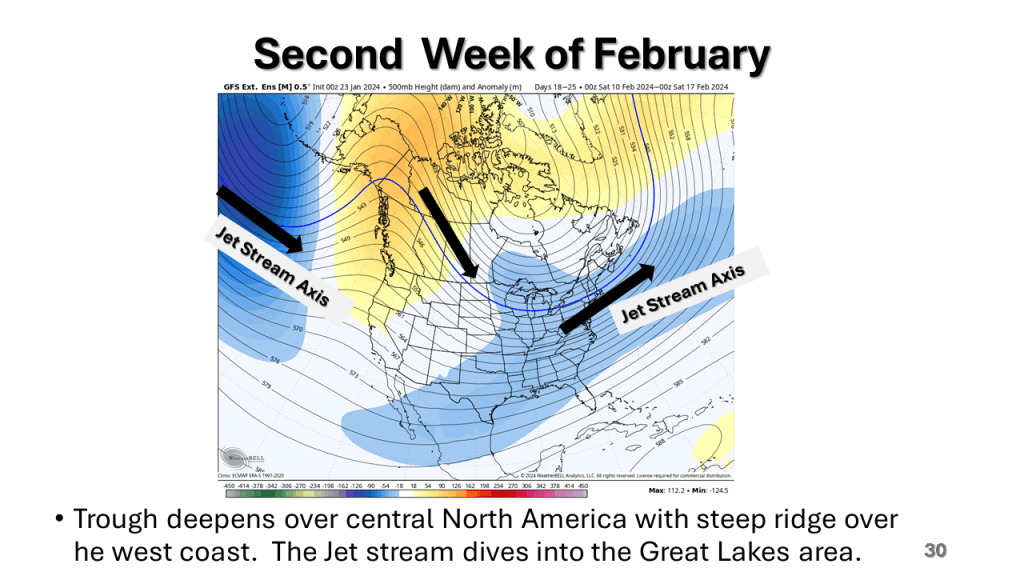
The bottom line is it will be very warm, relative to normal until around Valentine’s Day, the it will get cold across most of the central and eastern CONUS with a significant amount of snow over the Great Lakes and New England.
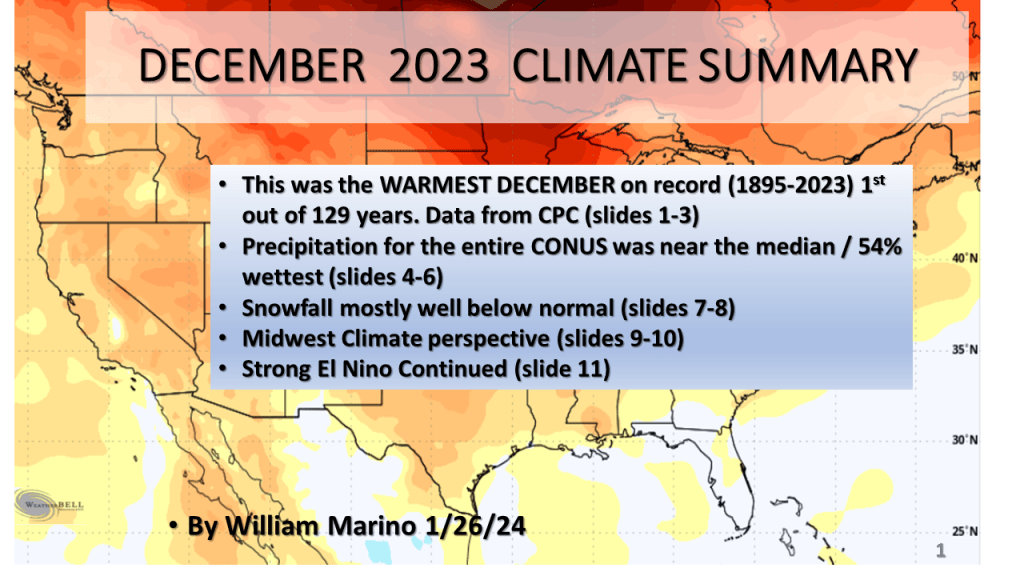
Record warmest December for the CONUS (1st out 129 years)
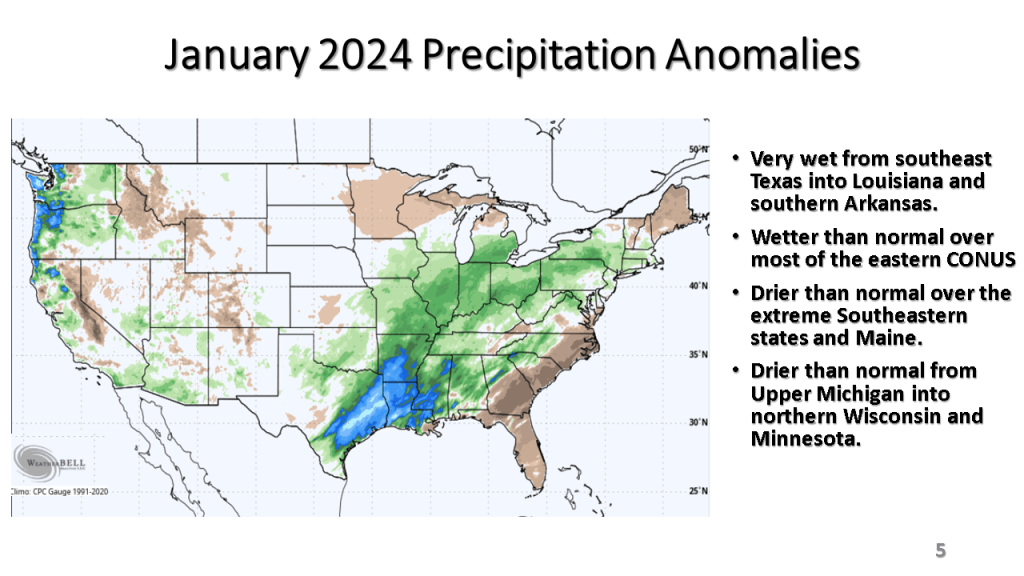
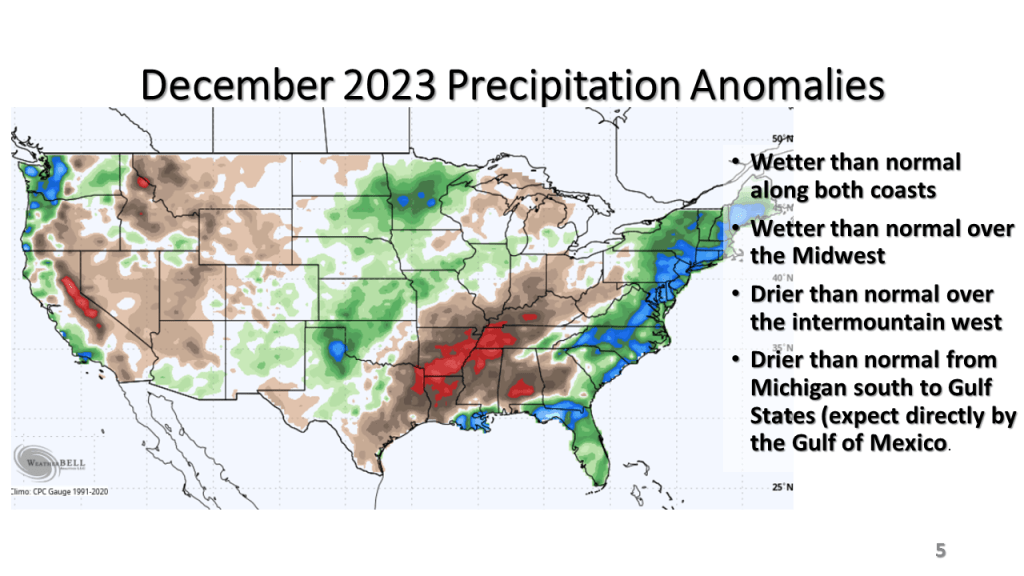
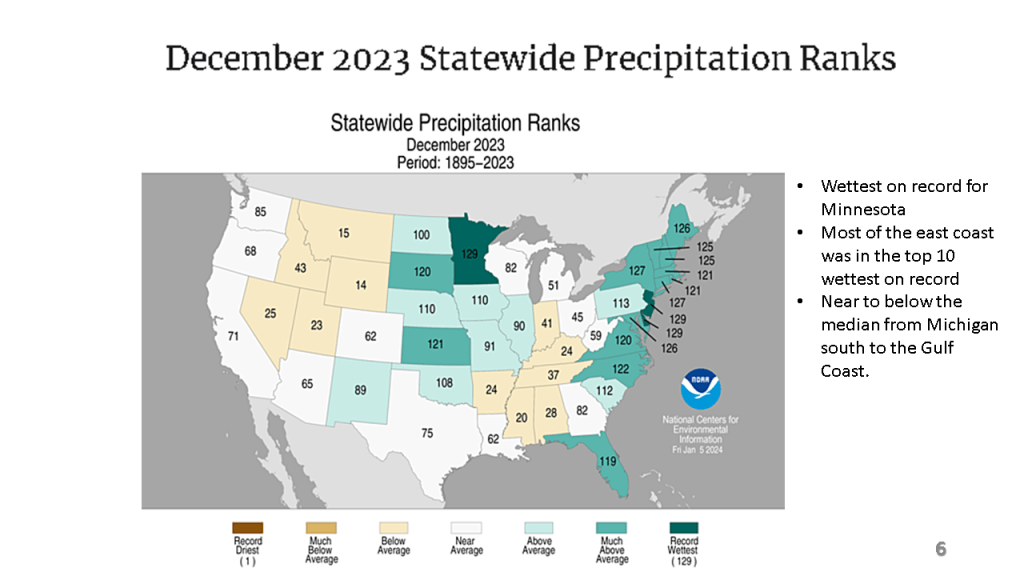
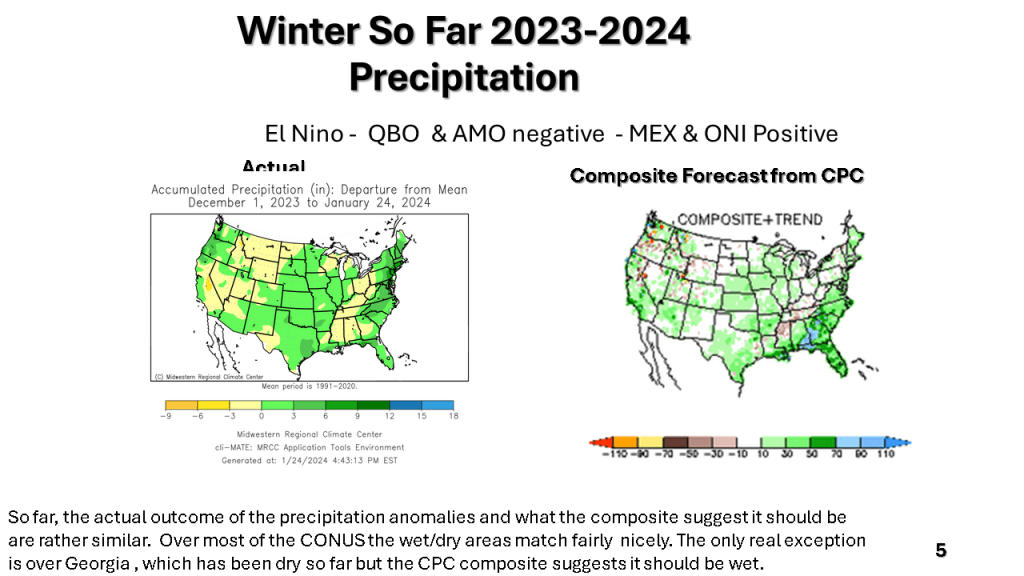
Precipitation was near normal (70th out of 129 years)
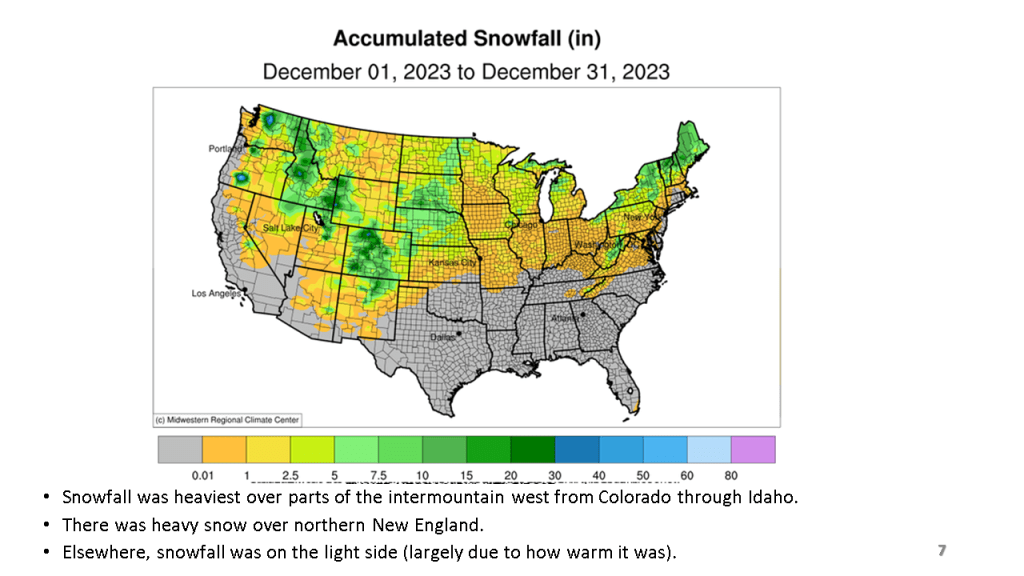
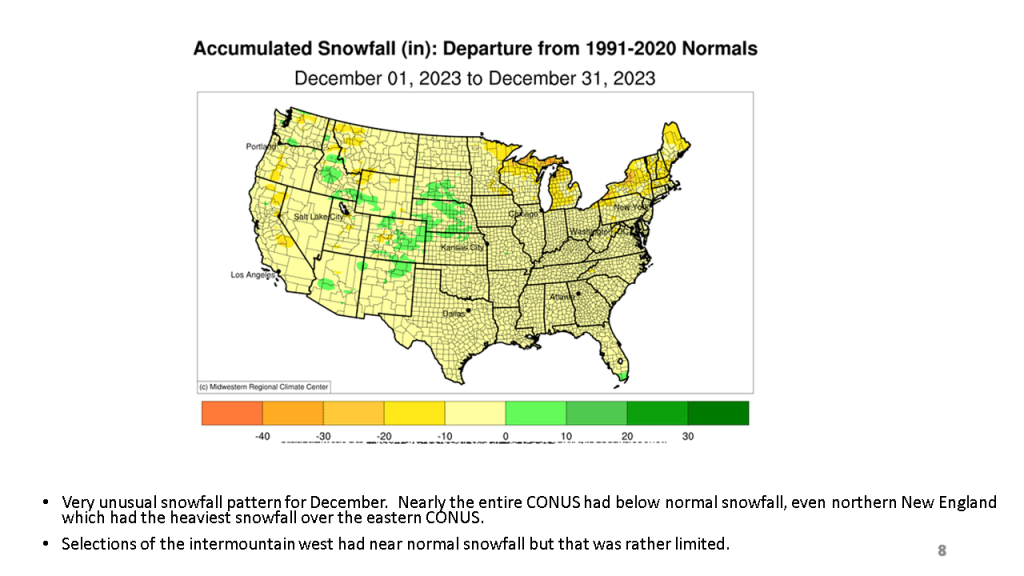
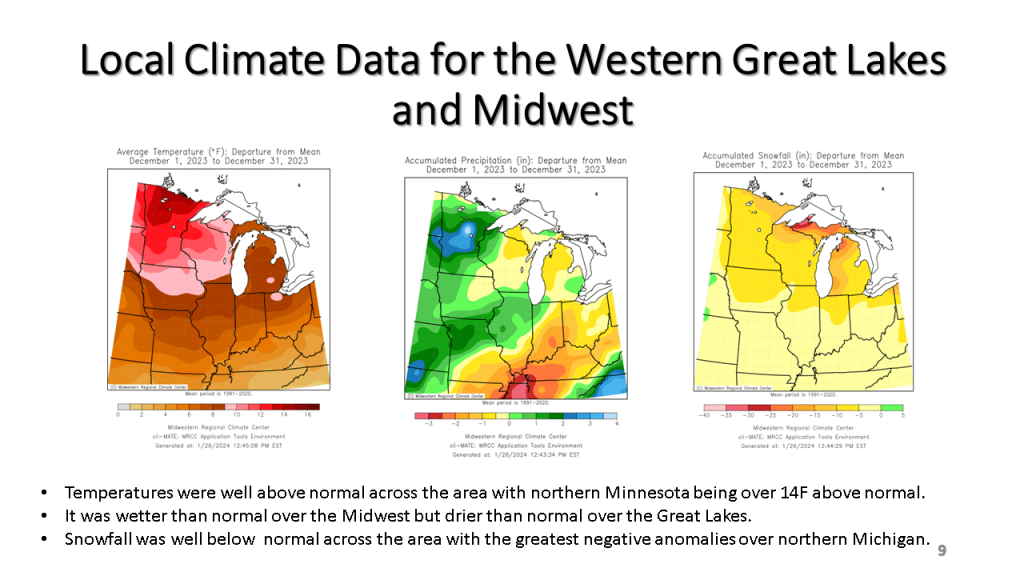
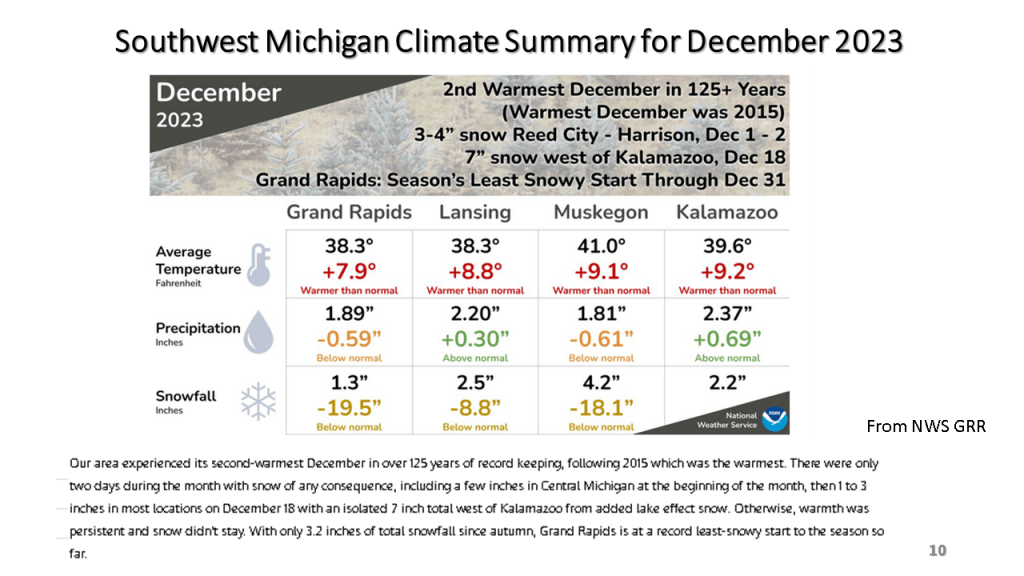
Snowfall was well below normal across the CONUS
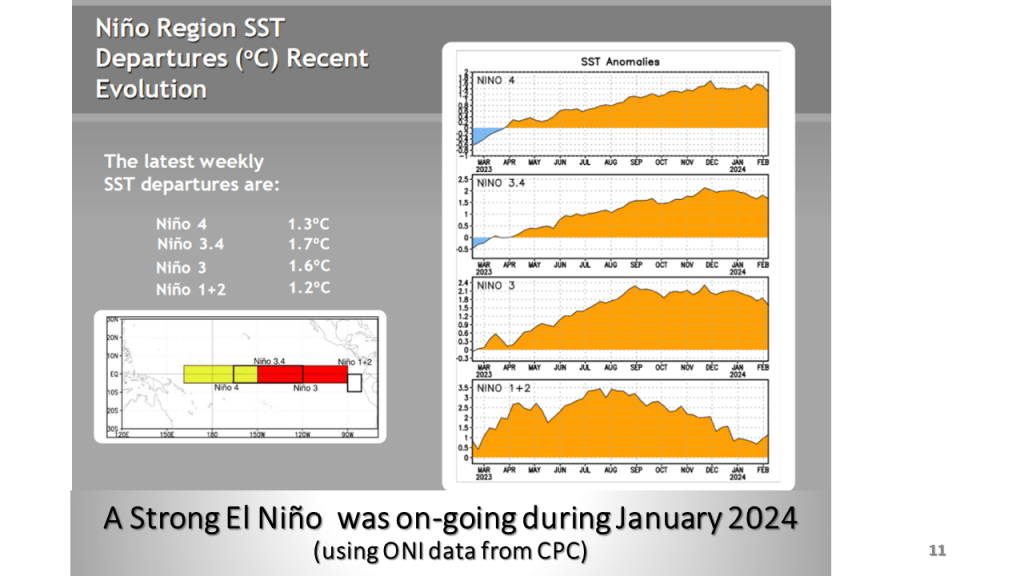
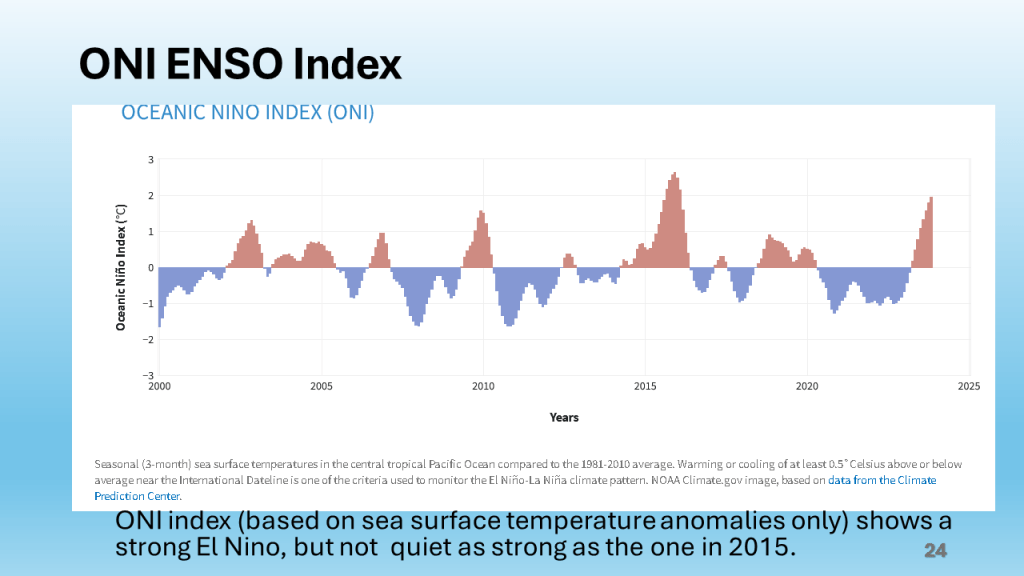
A strong El Nino Continued (based on ONI data from CPC)


Does the cold and snowy weather come back?


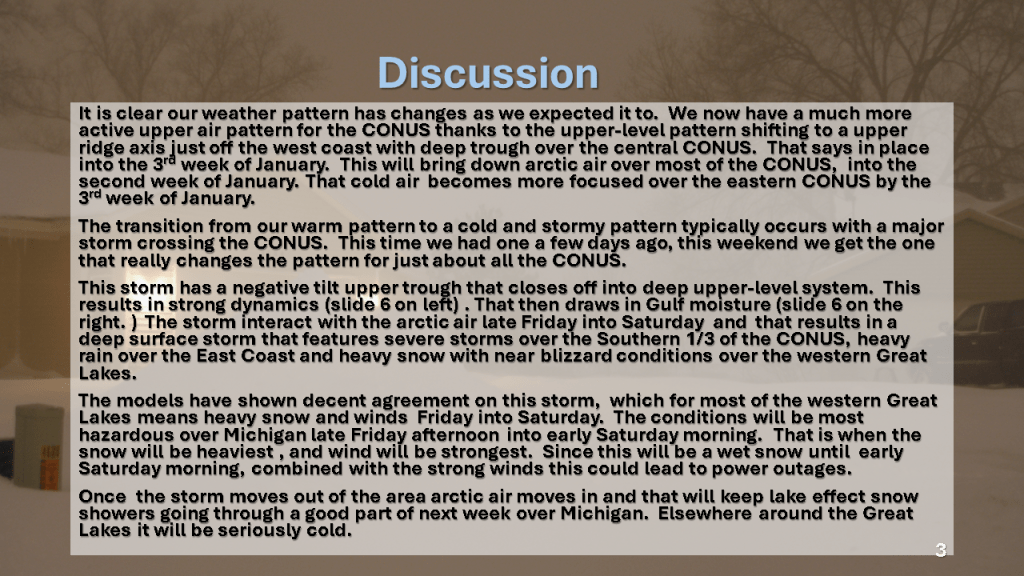


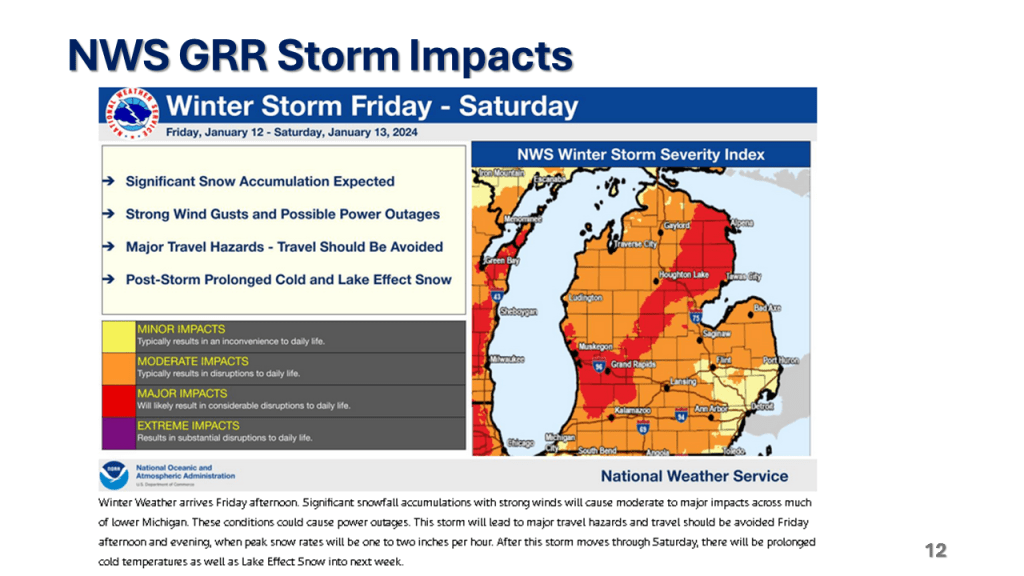

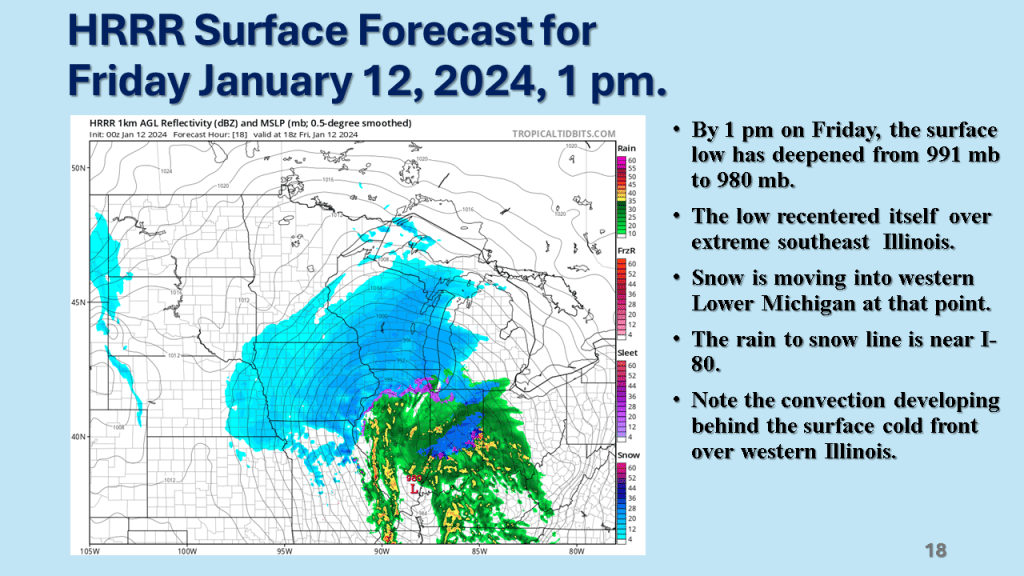


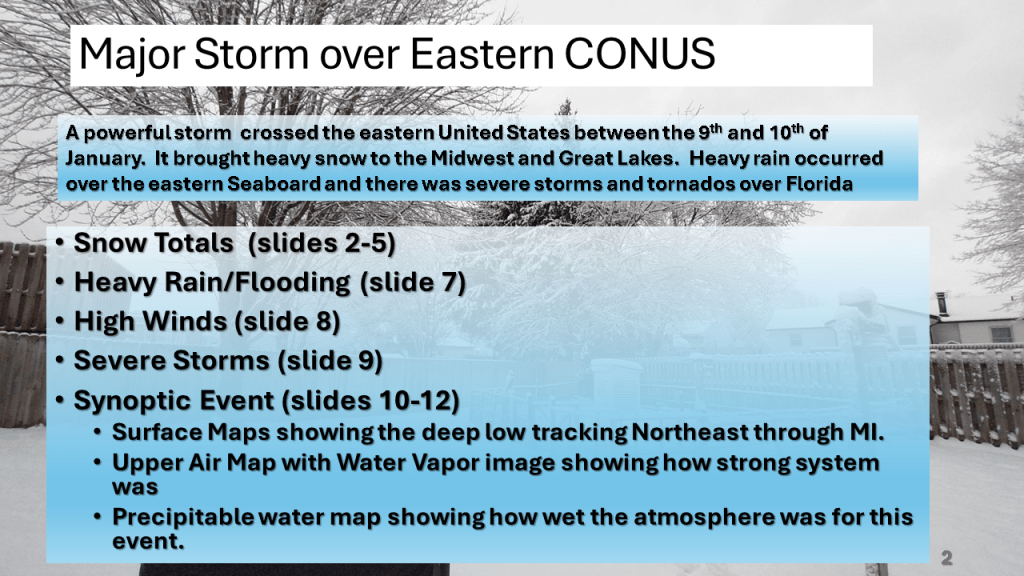
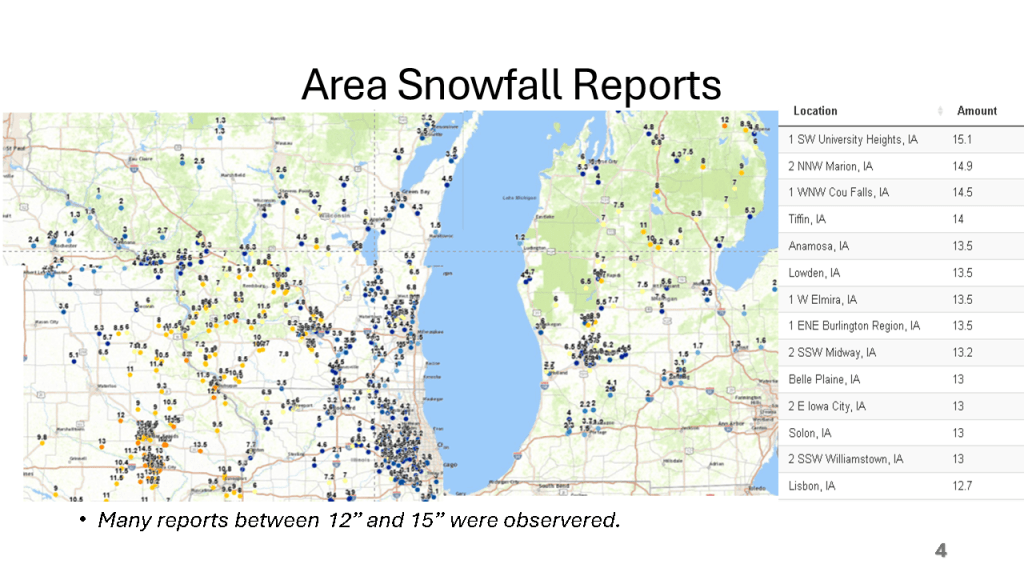
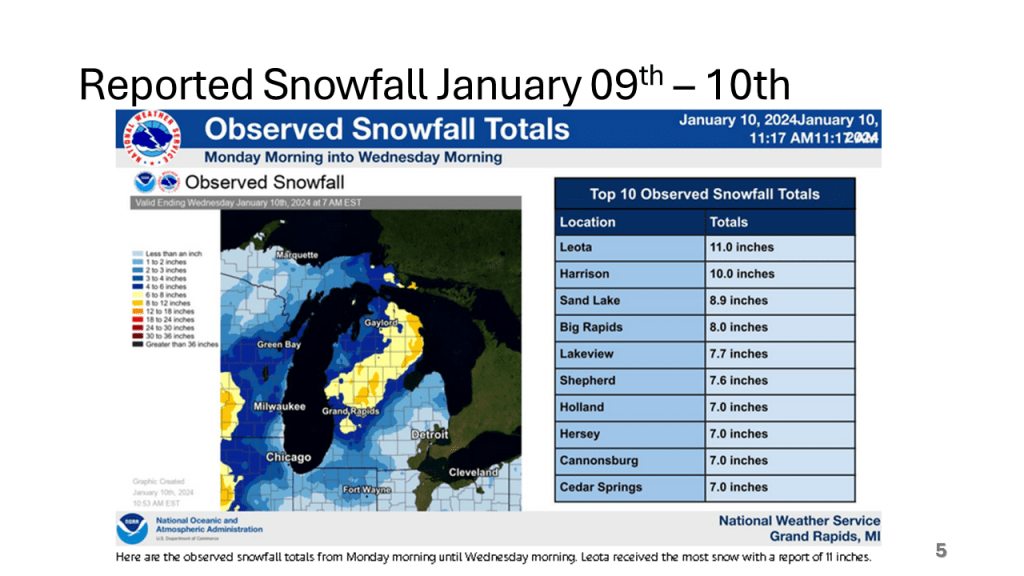
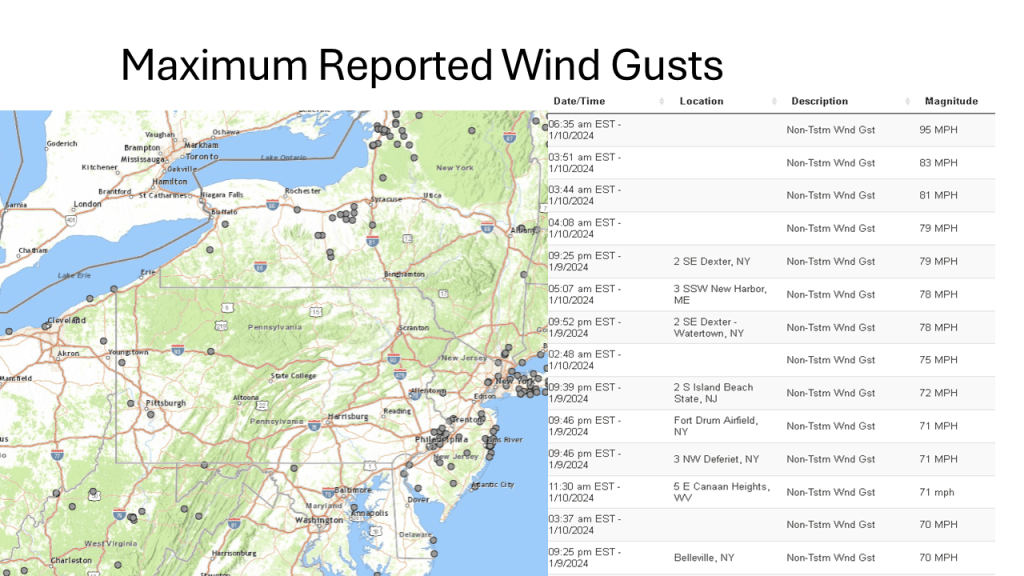
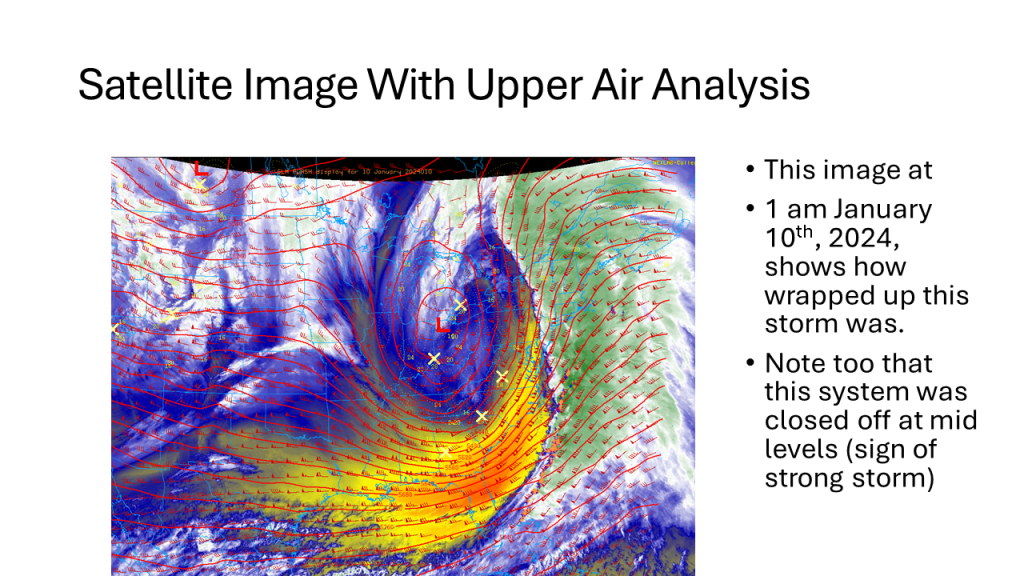
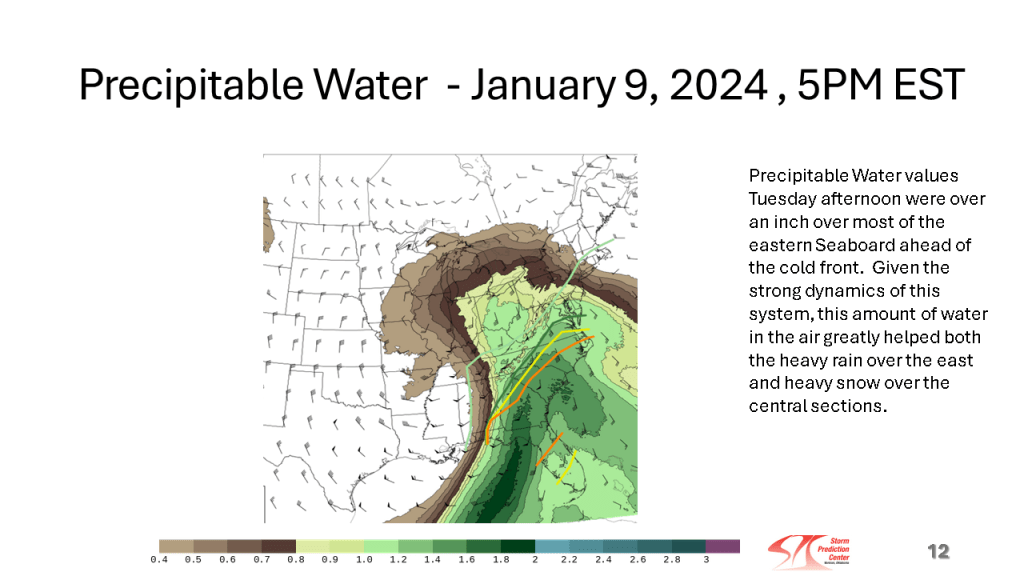
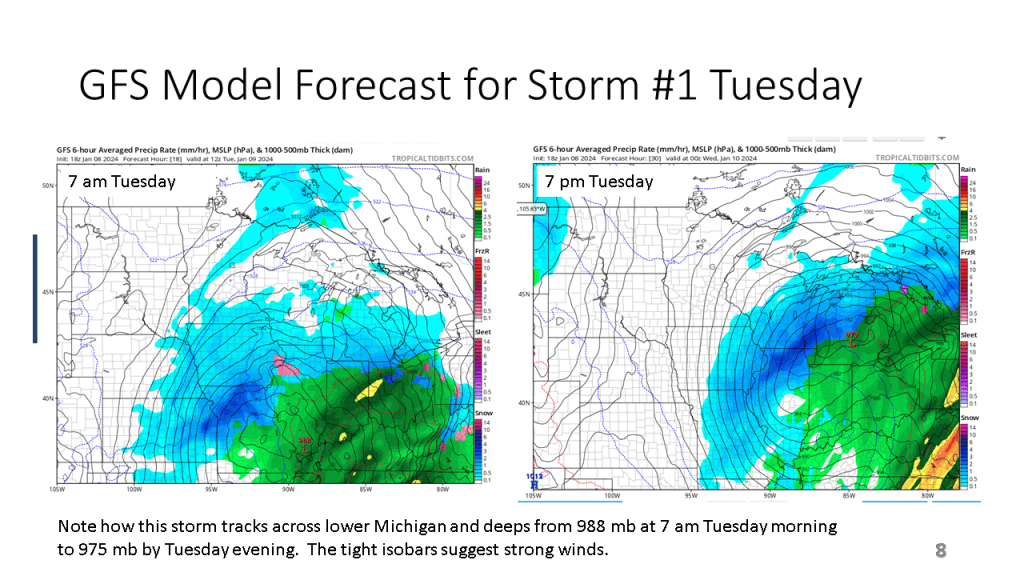
This storm brought heavy snow to the Midwest and parts of the Great Lakes, then there were damaging winds over the eastern Seaboard, as well as flooding. Severe storms and over a dozen tornadoes occurred over the Southeast sections.