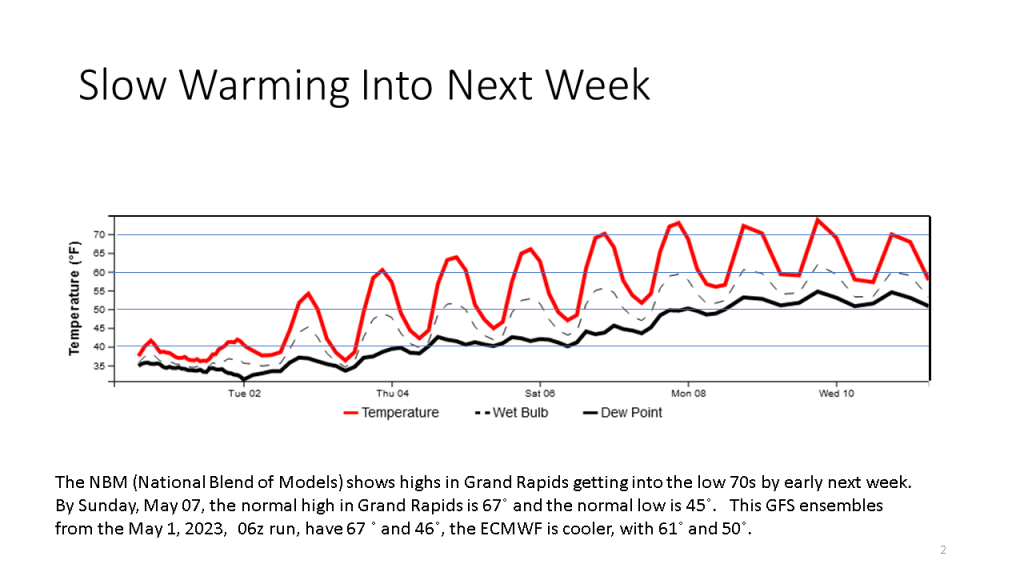

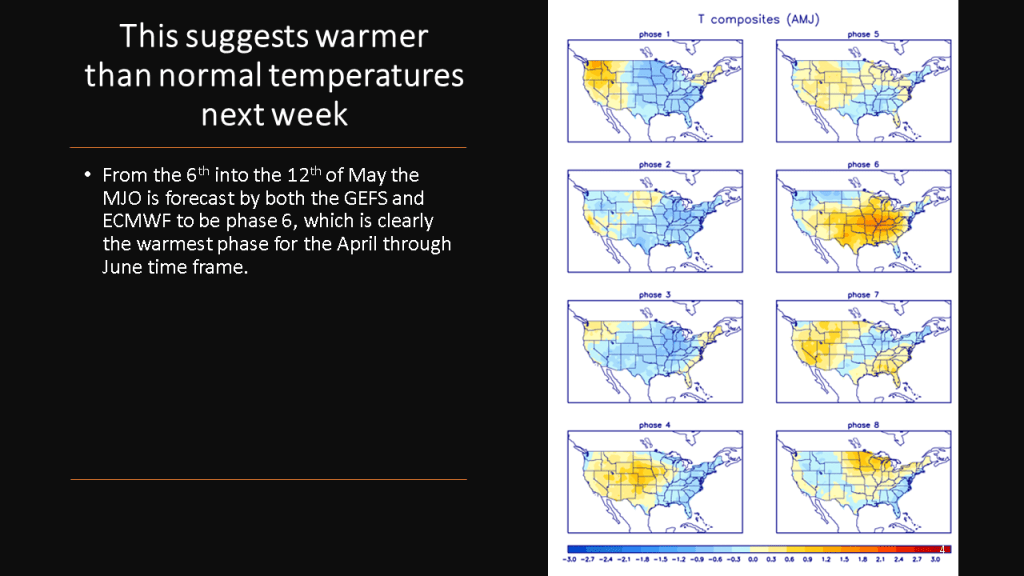
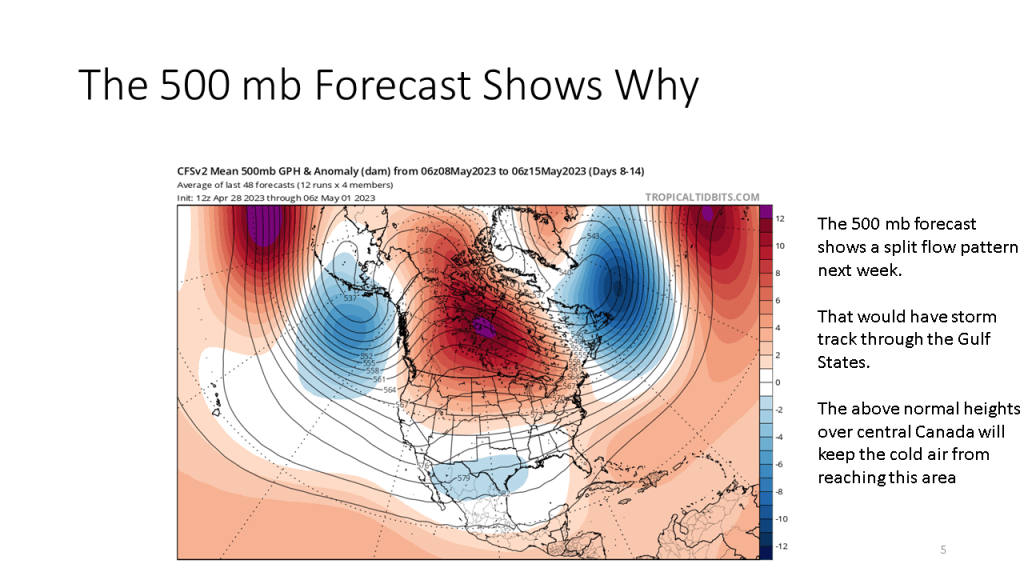


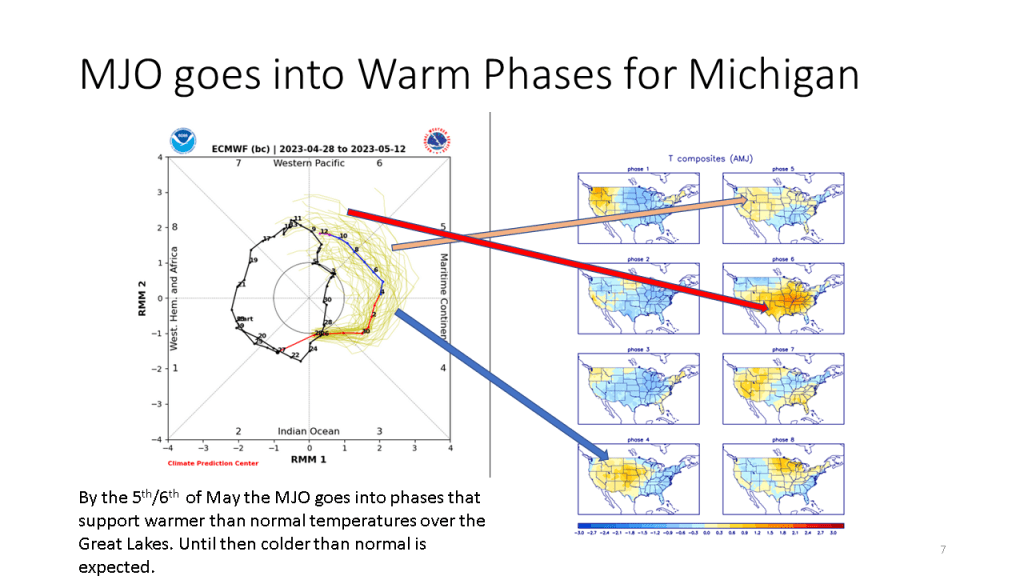
It may be cool today and tomorrow but warmer than normal temperatures are expected from this coming weekend through the 3rd week in May.
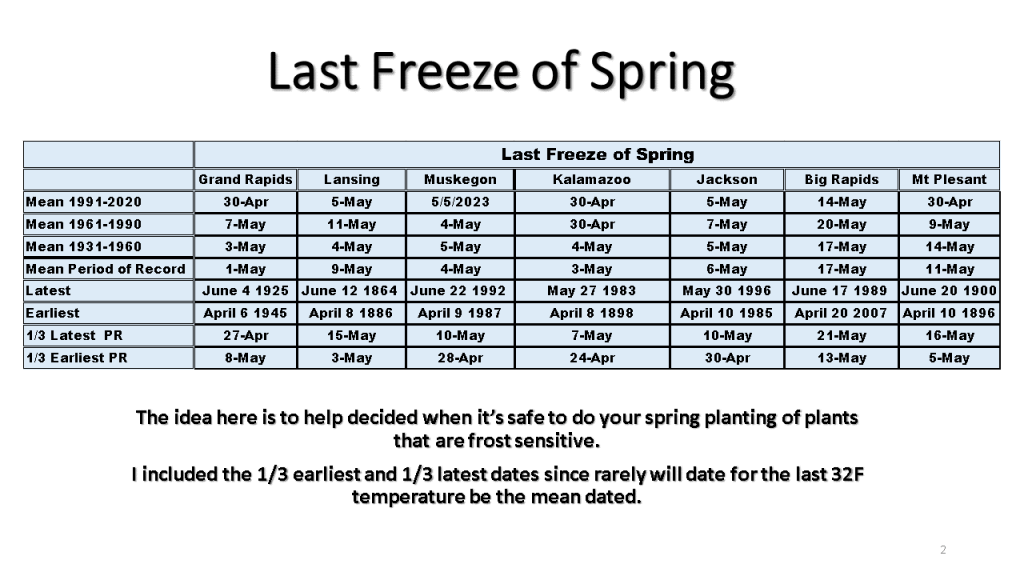
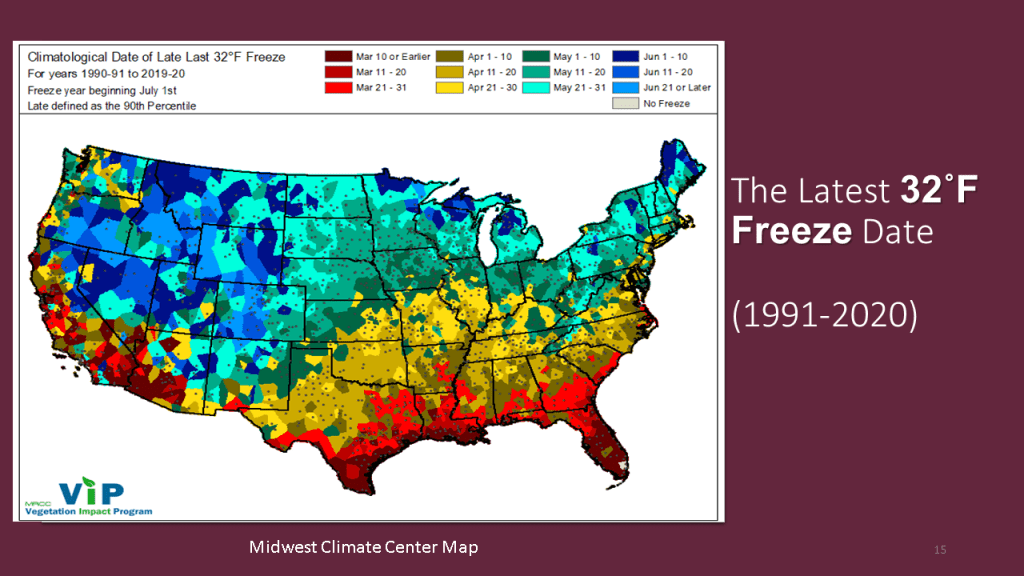
Here are the last freeze dates for several locations in Southwest Michigan


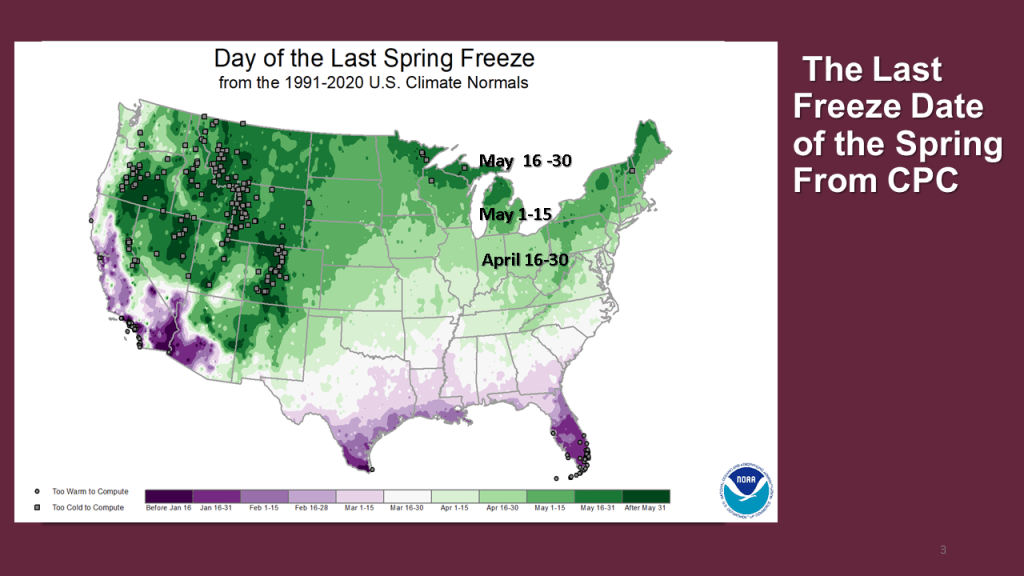
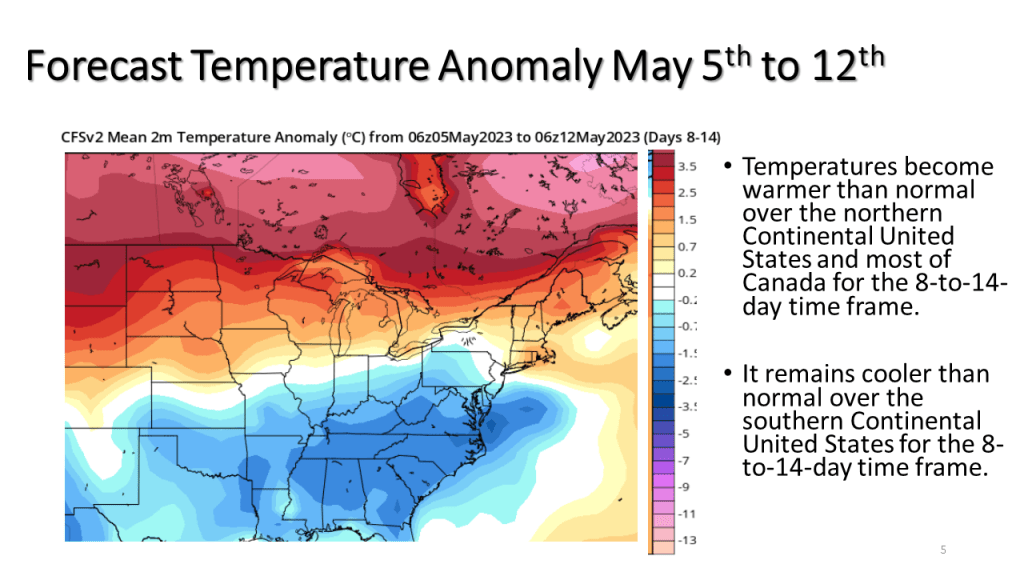
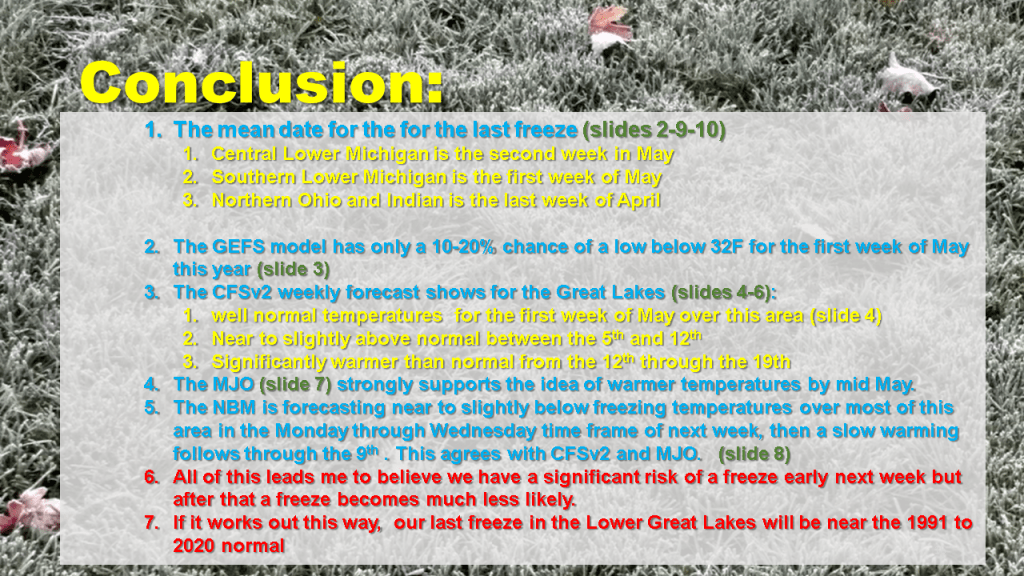
Freezing low temperatures should be expected over Lower Michigan next week (first week of May)


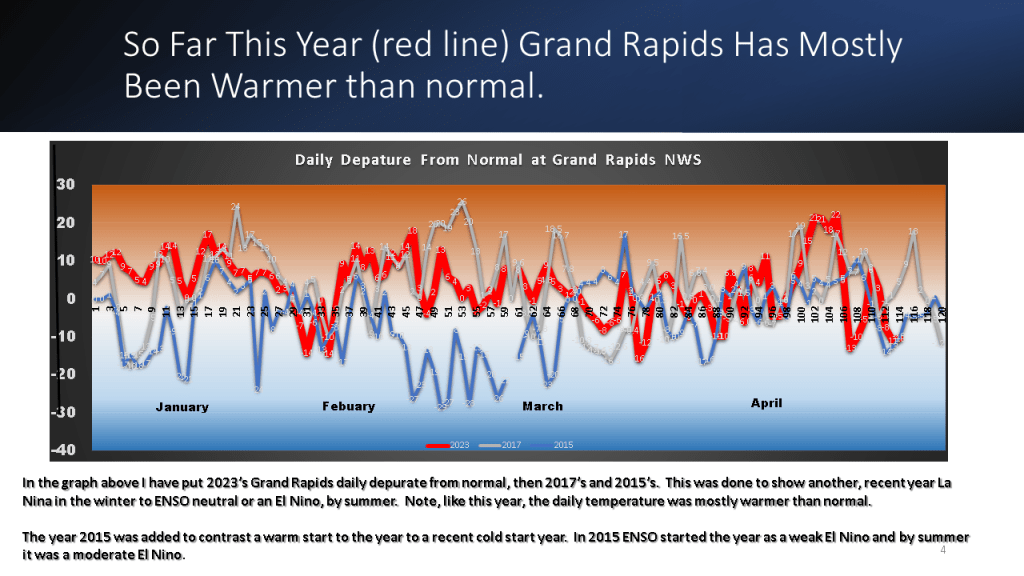
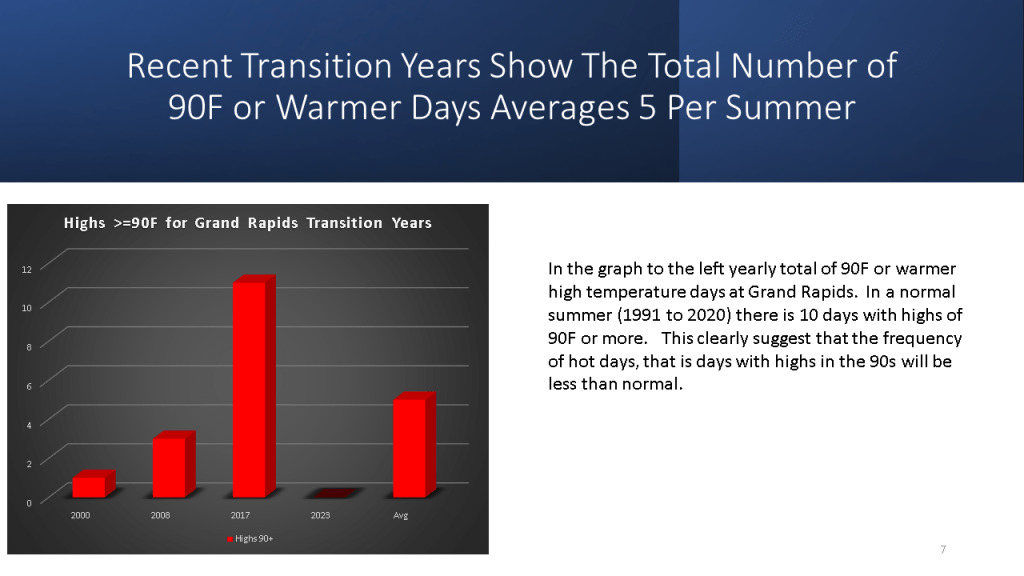
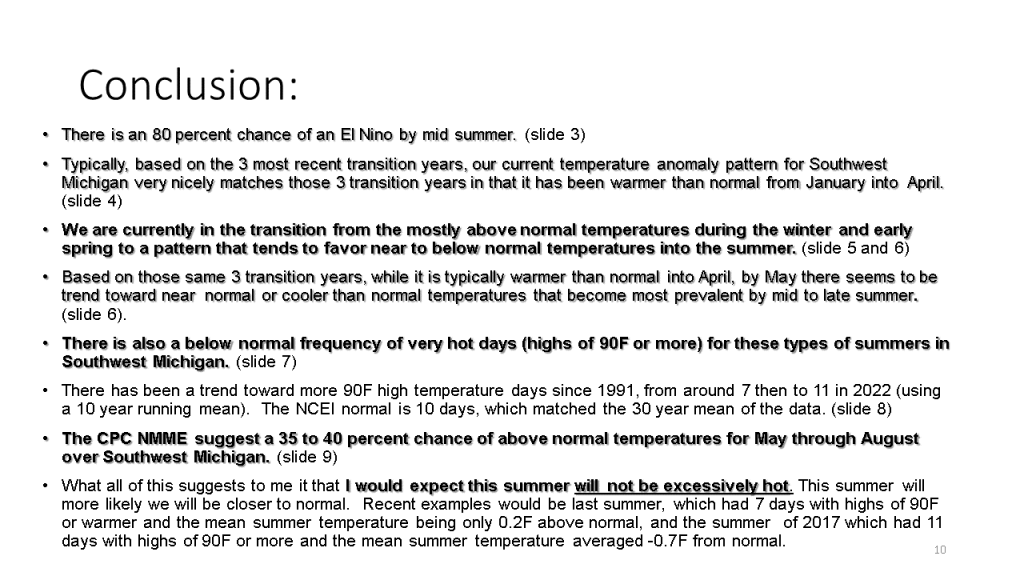
I am expecting this summer, in Southwest Michigan to be near normal to slightly warmer than normal in the mean temperature but the frequency of very hot days, highs of 90F or more is likely to be less than normal.


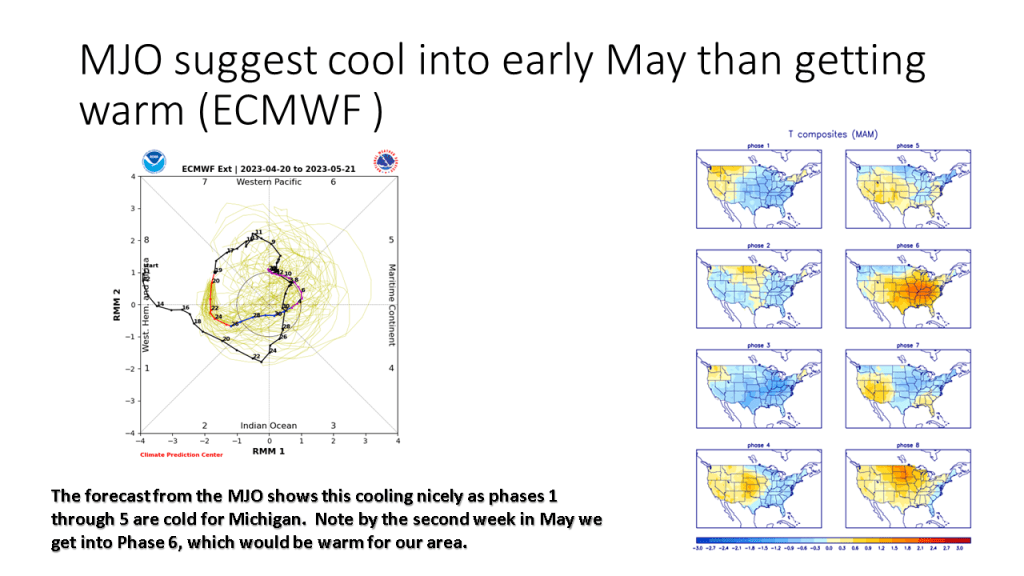
Cooler temperatures are expected to prevail over southwest Michigan into through the first week of May. Milder conditions are expected to follow by mid month.


Why May This Change Be Happening?
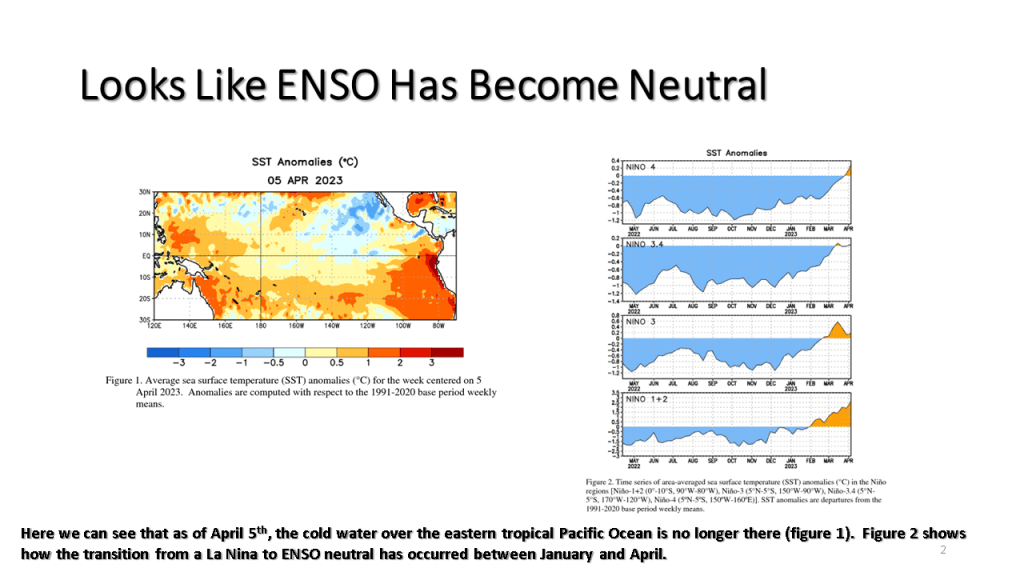
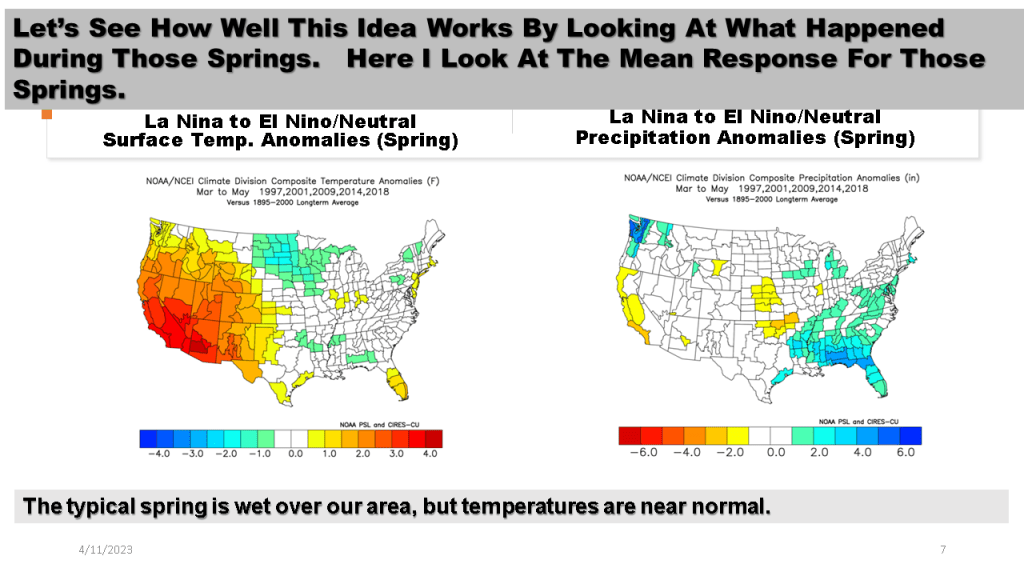
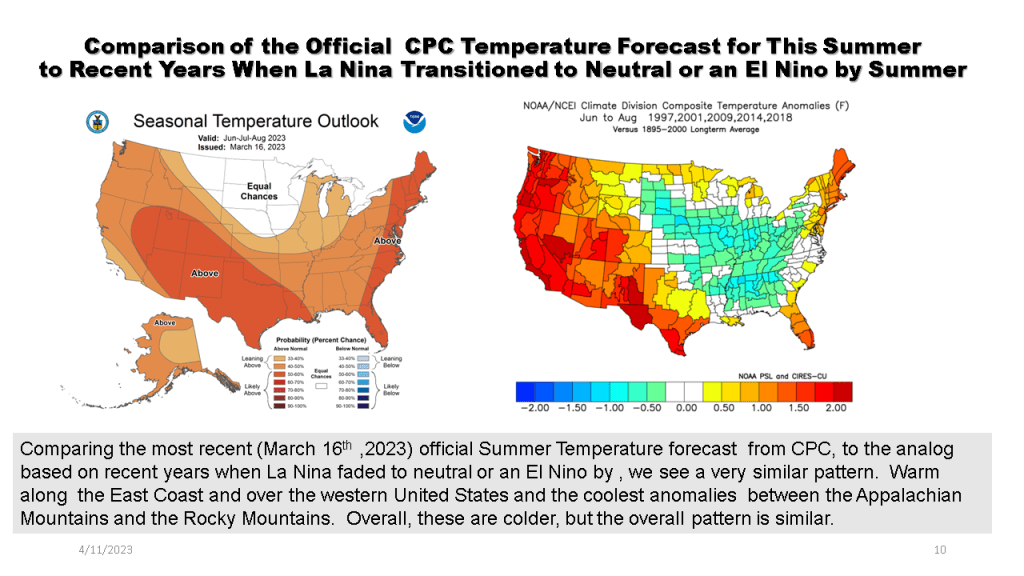
As for why this may be happening I will look at the how the water temperatures in the Tropical Pacific have recently changed. Typically this sort of change forces large scale changes in the northern hemisphere wave pattern.


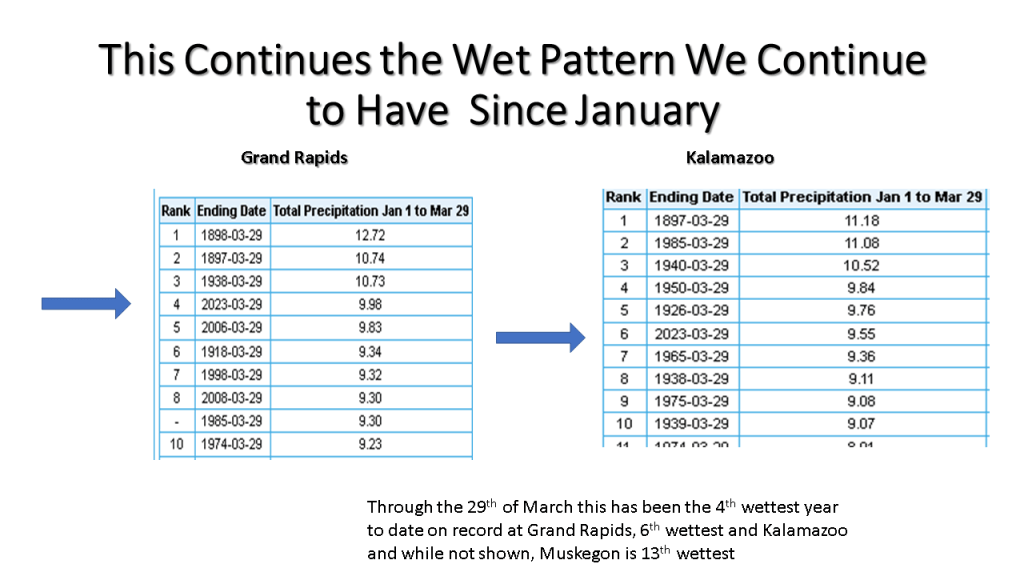
All of the data for the tables comes from either the Midwest Climate Center , xmACIS2, The National Hurricane Center and NOAA’s Physical Science Laboratory https://psl.noaa.gov/


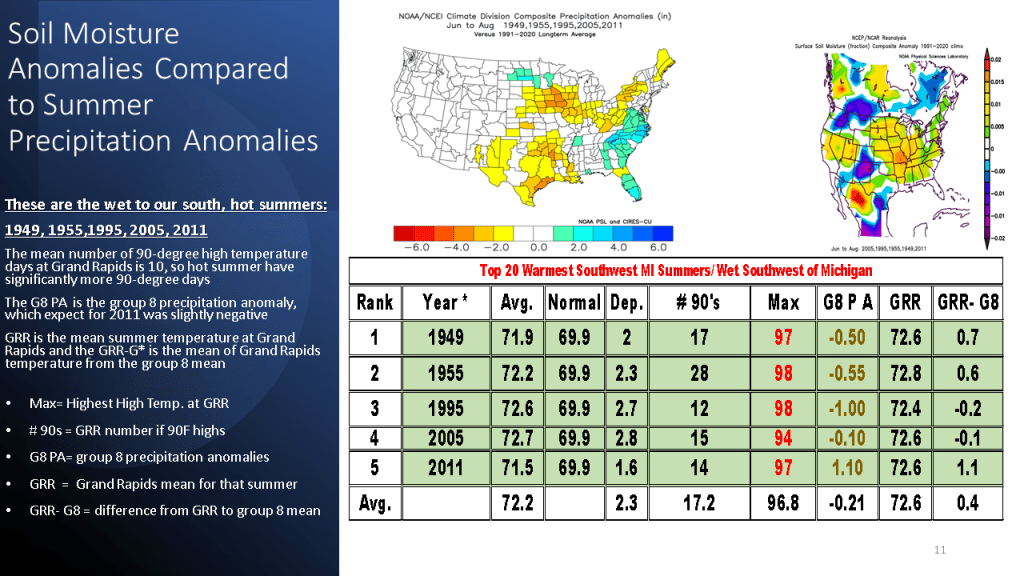
Below are the wetter to 20 warmest summers

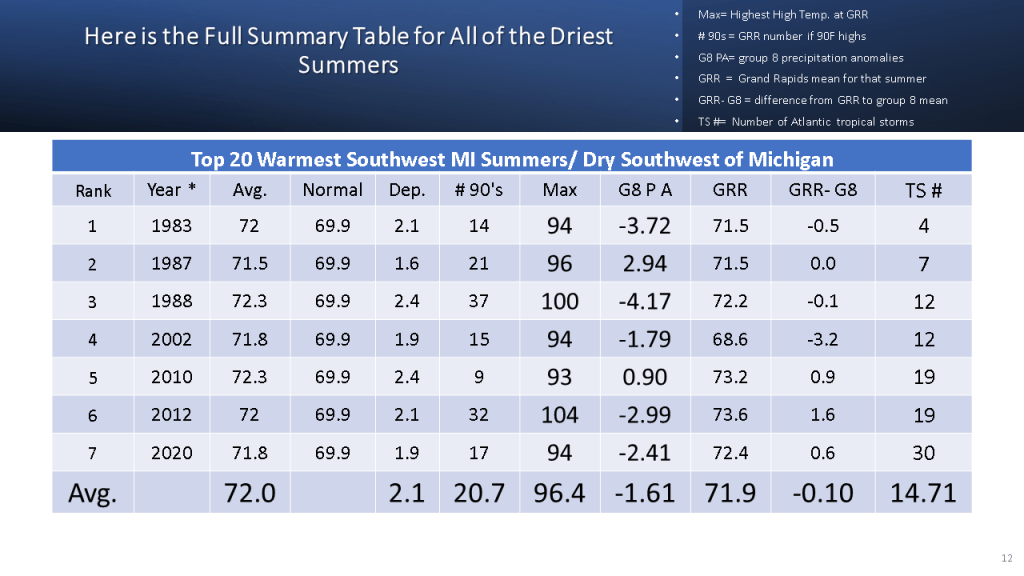
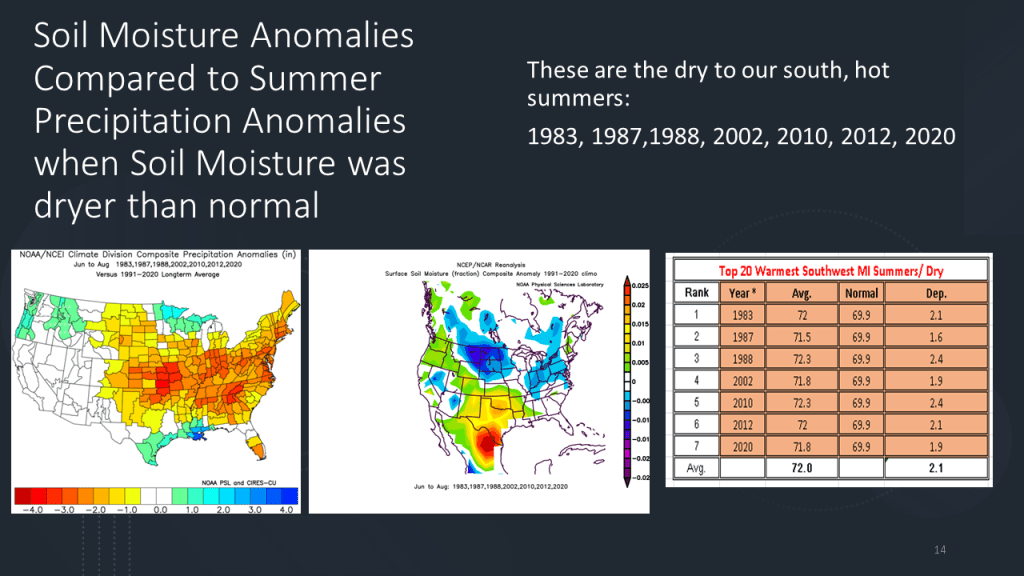
Now we will consider the driest warm summers

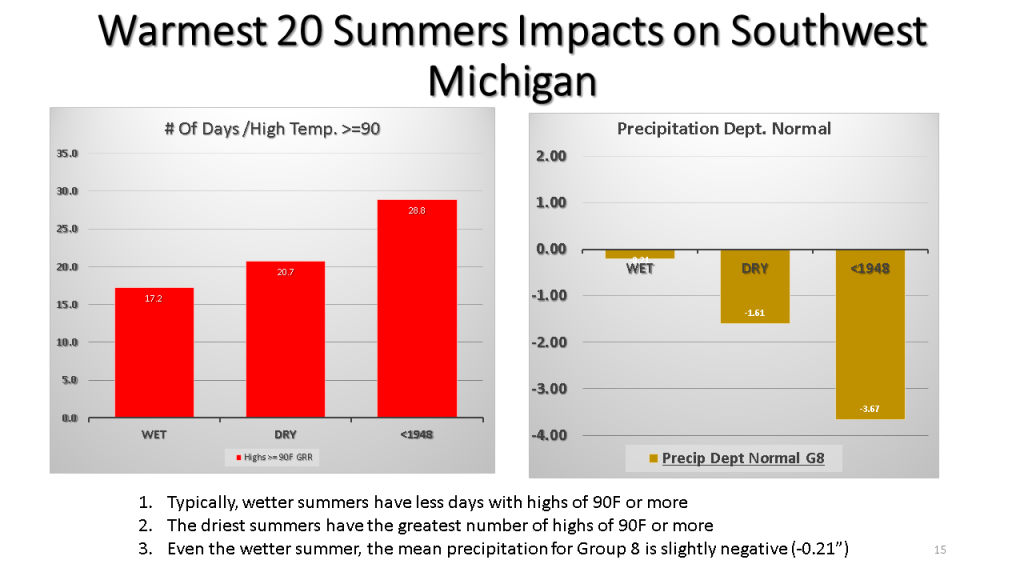
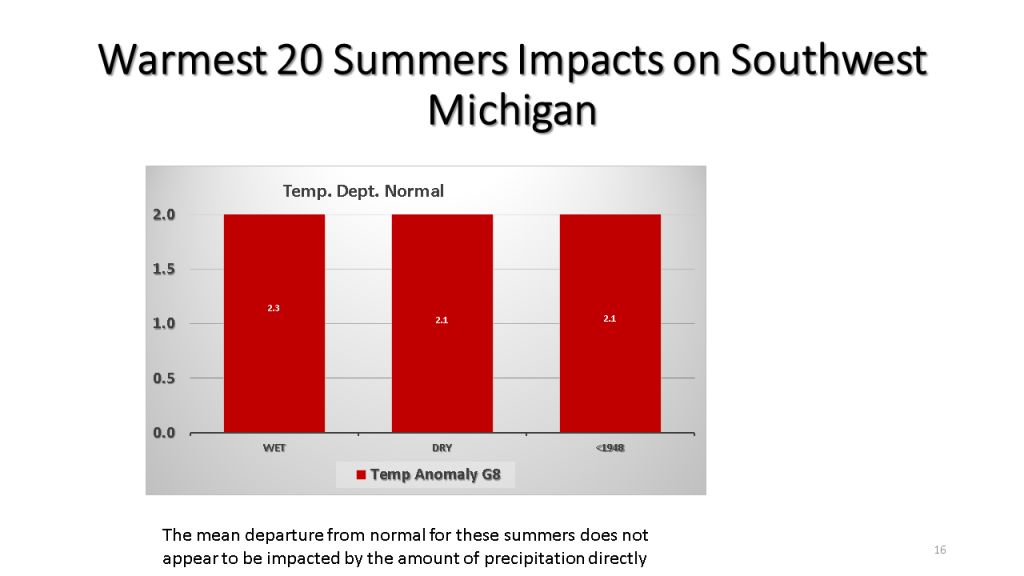
Here are the impacts for Southwest Michigan during those 20 warmest summers
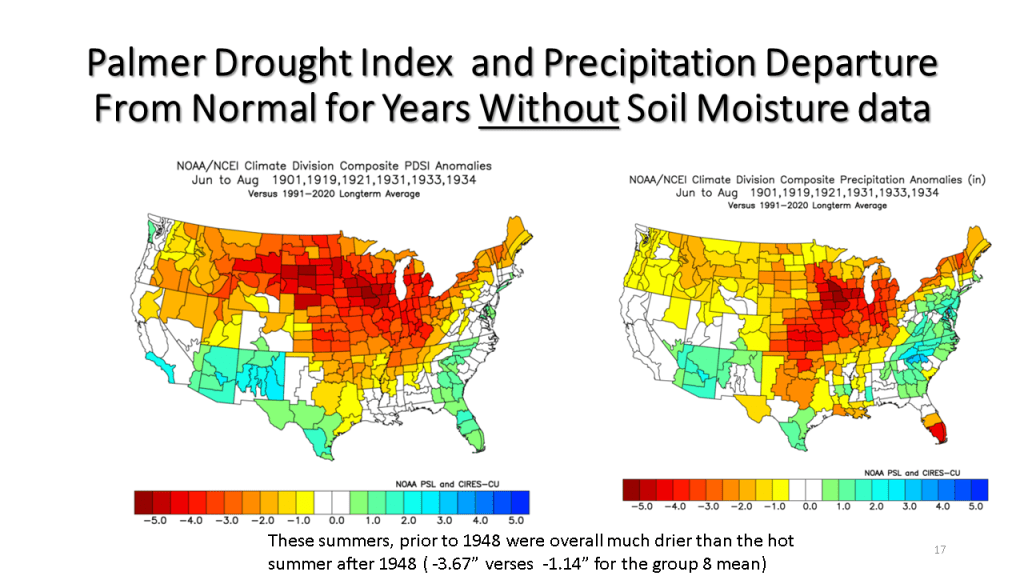
Let’s look at the Palmer Drought Index compared with both the Soil Moisture Anomalies and Precipitation Anomalies.


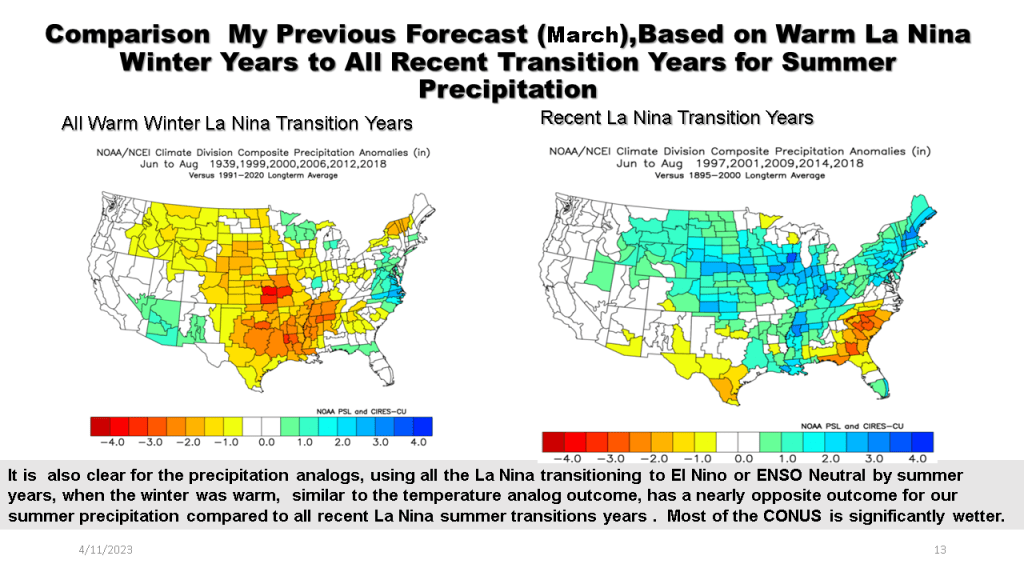
I am expecting the summer of 2023, over southwest west Michigan to feature near normal temperatures when June, July and August’s mean temperatures are averaged together. I am also expecting this summer to be wetter than normal across all of Southwest Michigan
I have updated my summer forecast for southwest Michigan based on the impact of warmer sea surface temperature over most of oceans in the more recent 30 years. Curiously the outcome, from my updated analogs would suggest a near normal temperature outcome and but a continued wet weather pattern into the summer months.


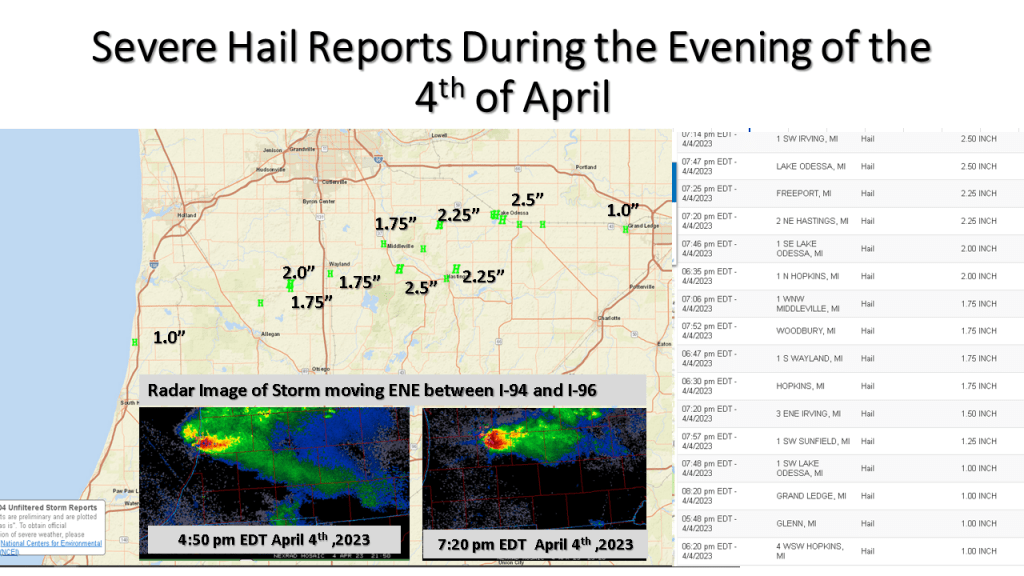
First severe storm event of 2023 for Southwest Michigan