(Severe reports were mostly large hail near Lansing)


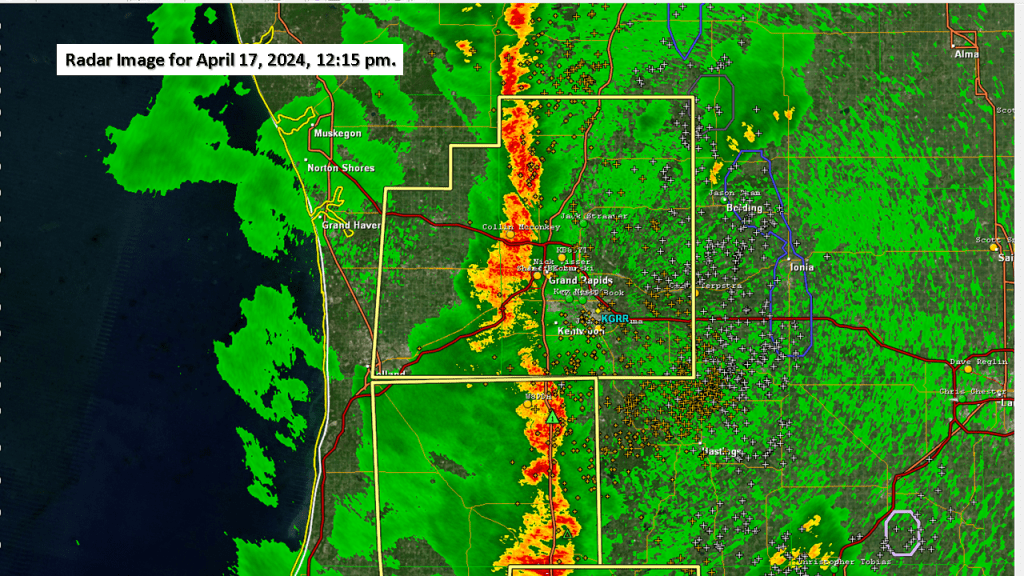
(Severe reports were mostly large hail near Lansing)
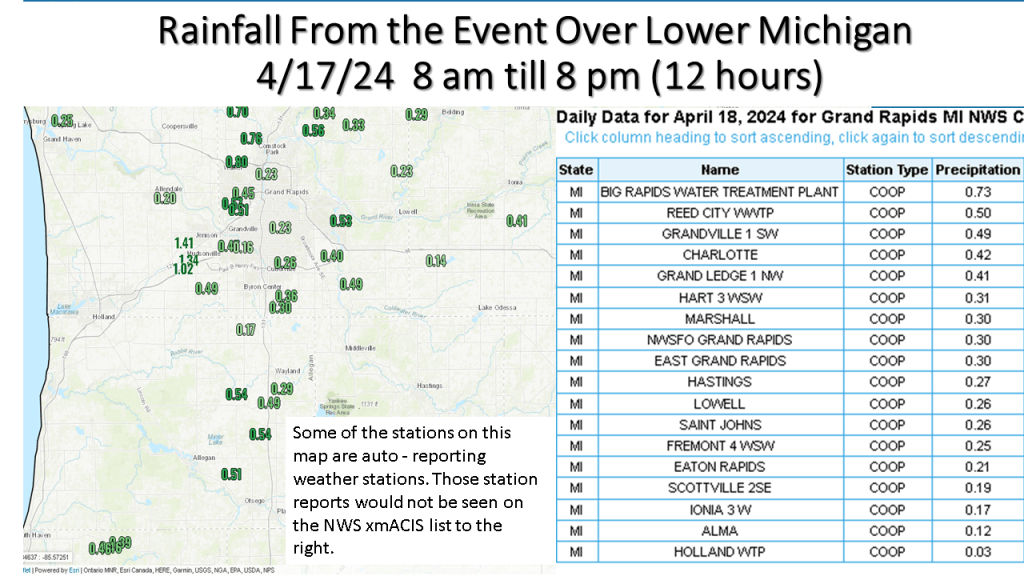
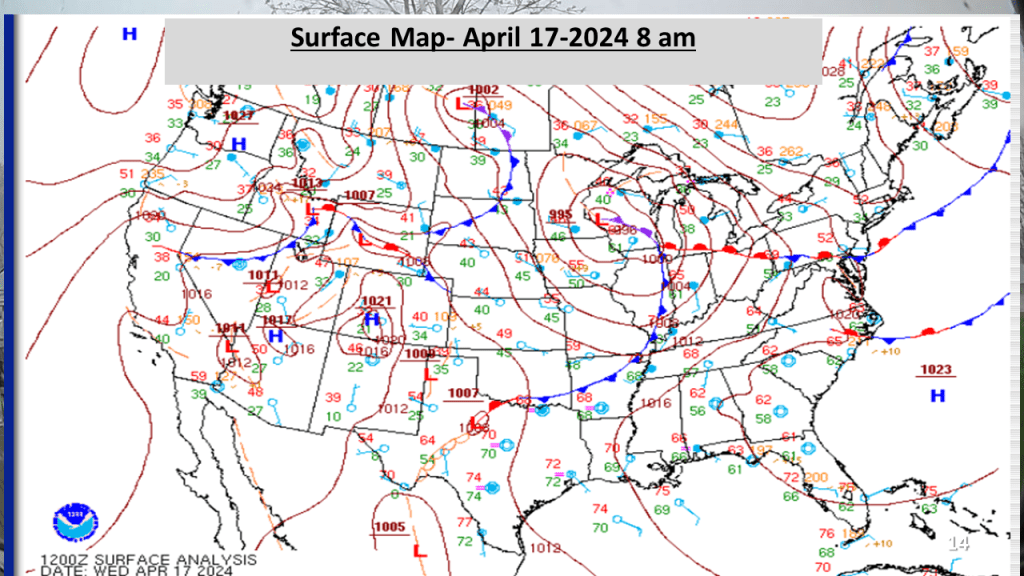
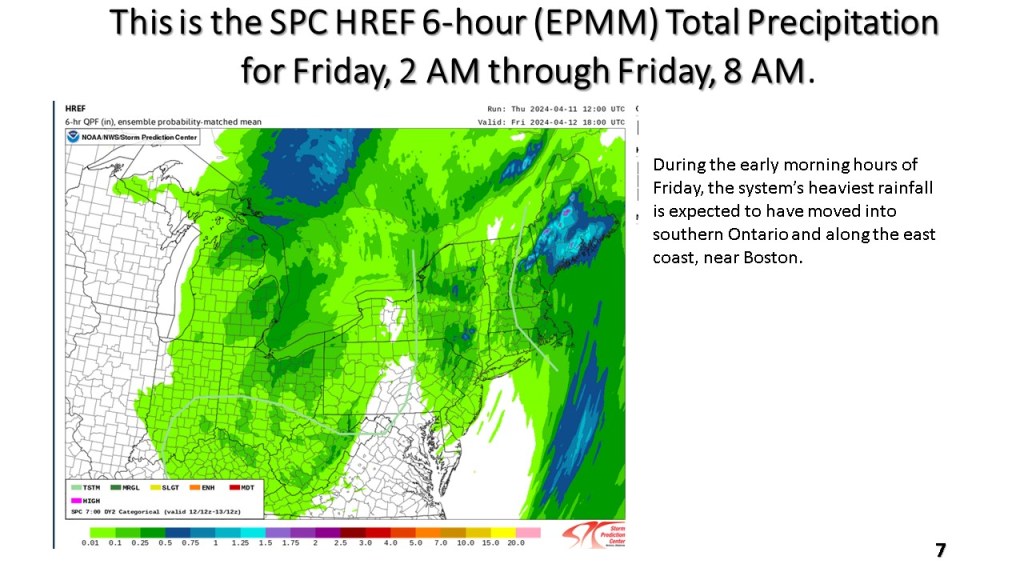
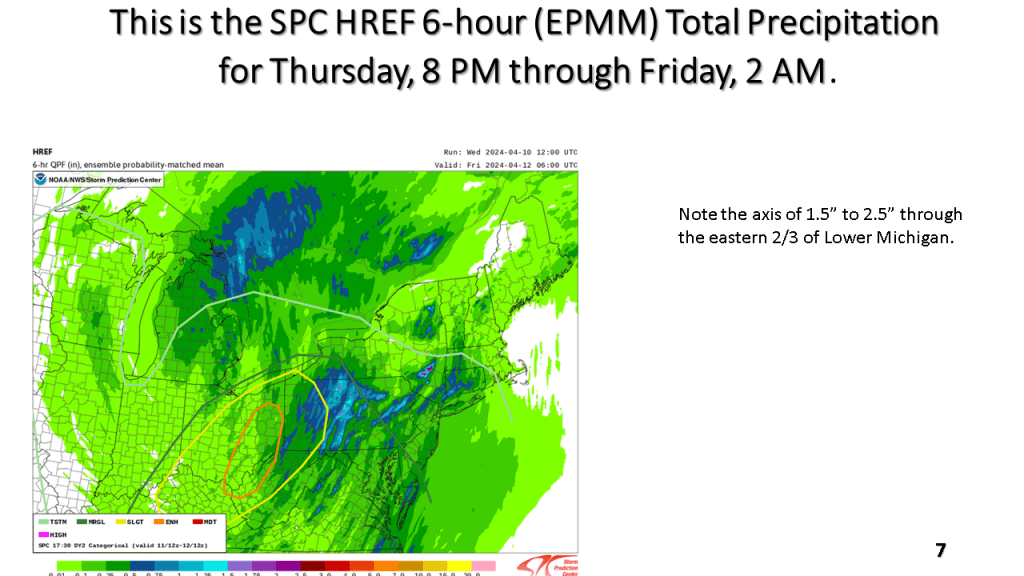
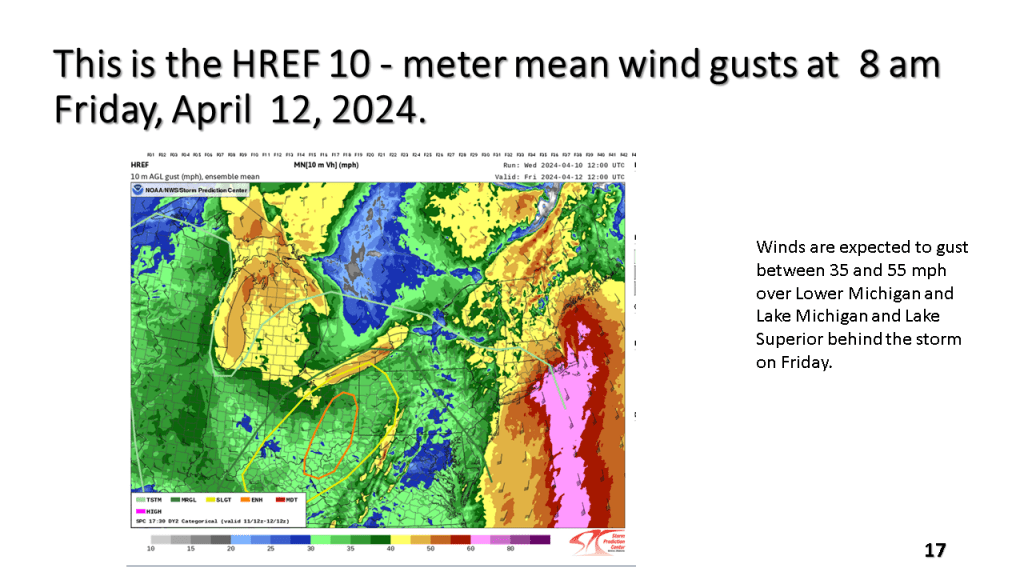
One to two inches of rain fell over a good part of Lower Michigan during this time. A rapidly deepening surface low tracked north across Lake Huron Friday, April 12, 2024 deepening below 980MB by late in the morning. This resulted in winds gusting to 40 to 60 mph across most of the area.


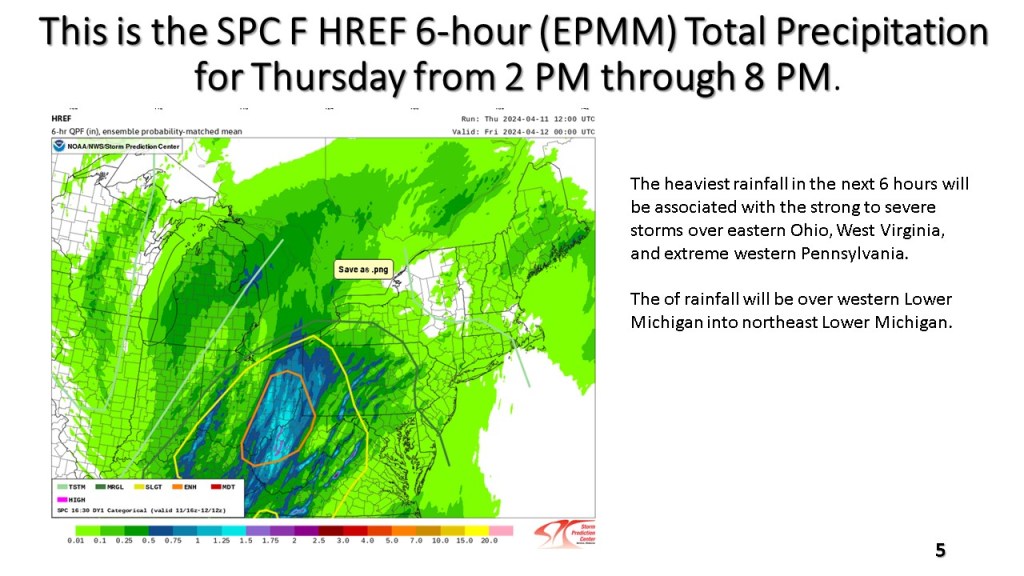


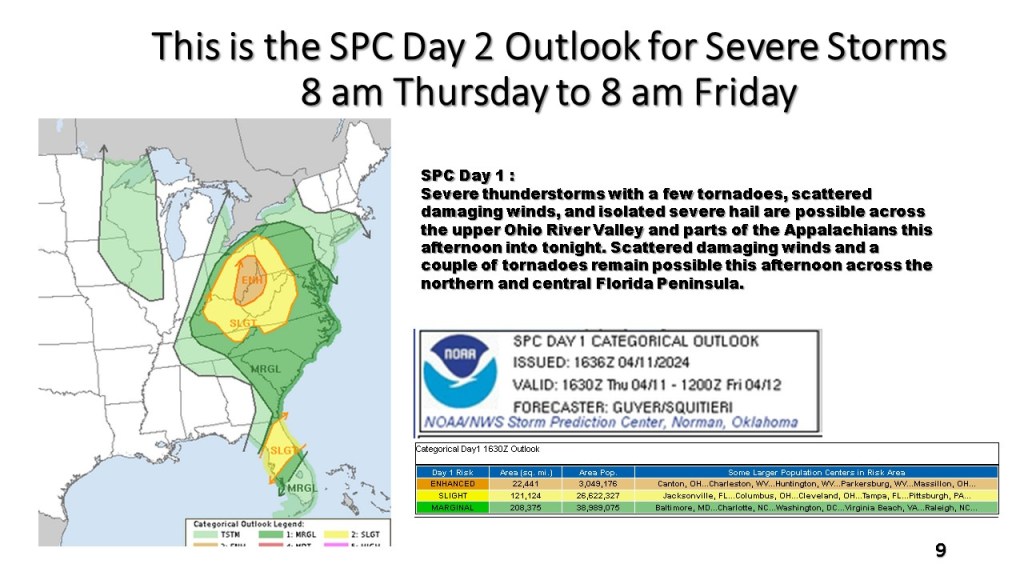


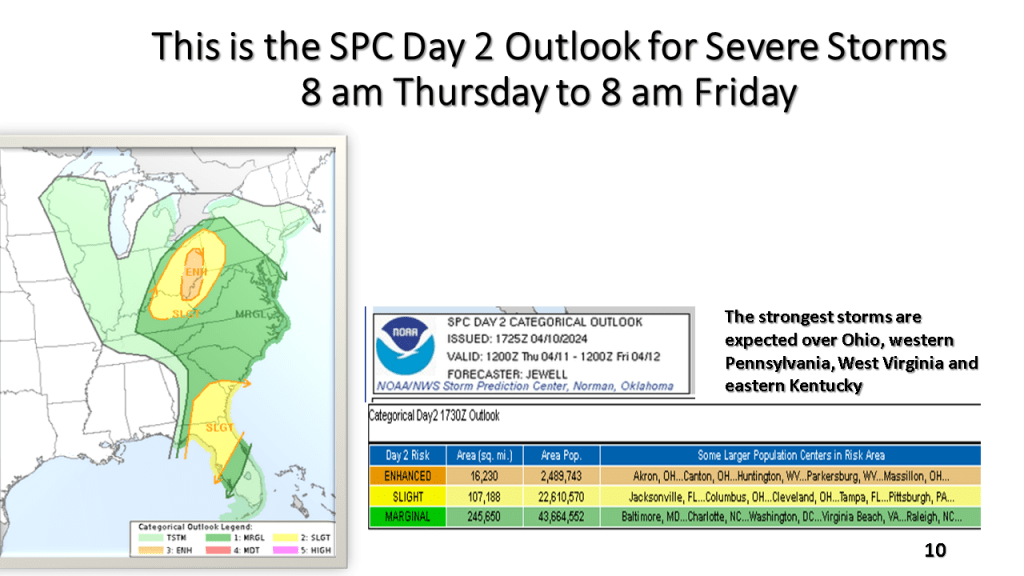
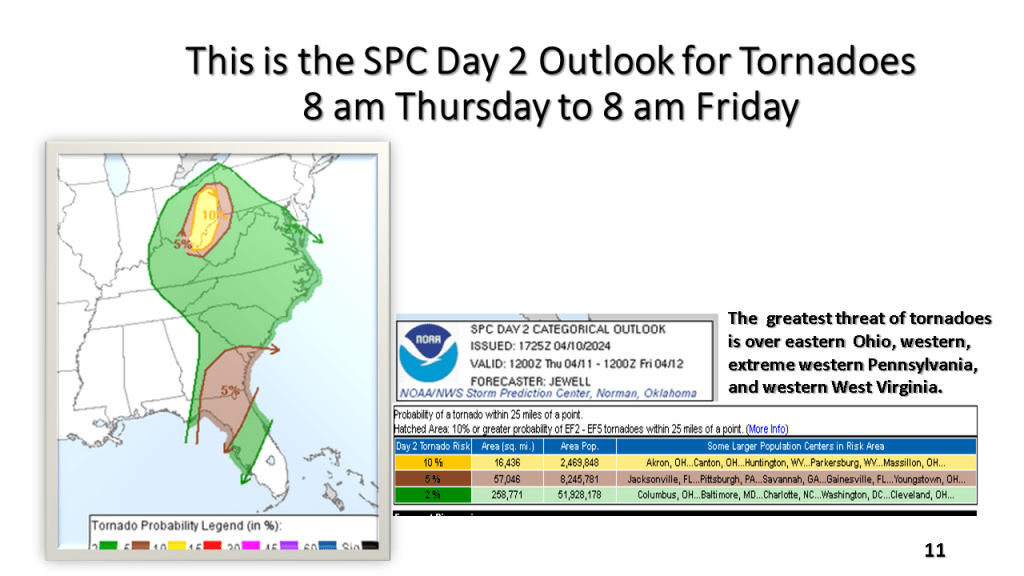
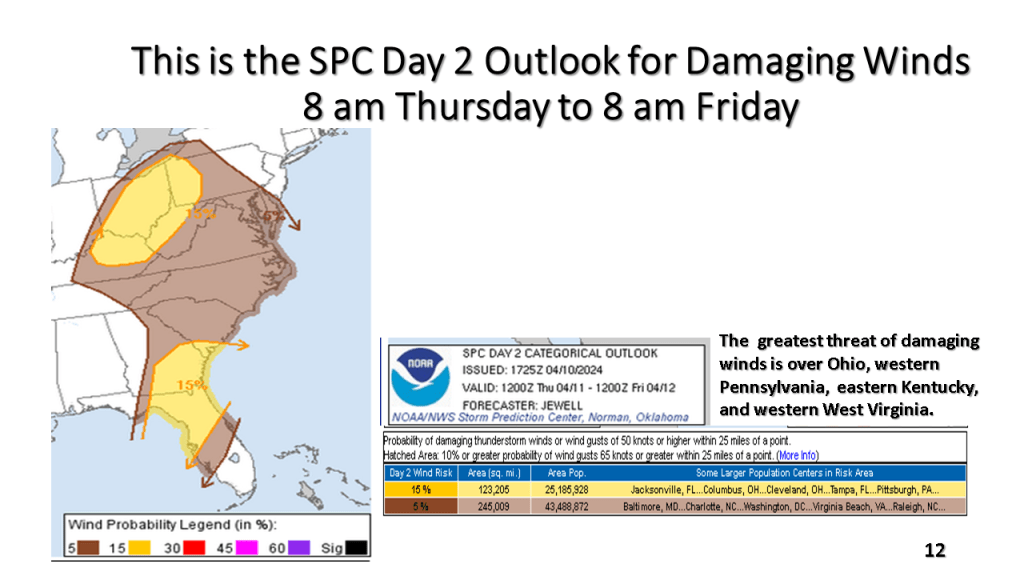
South of Michigan there is an enhanced risk for severe thunderstorms, including tornadoes over Ohio, western Pennsylvanian, West Virginia, and Kentucky.


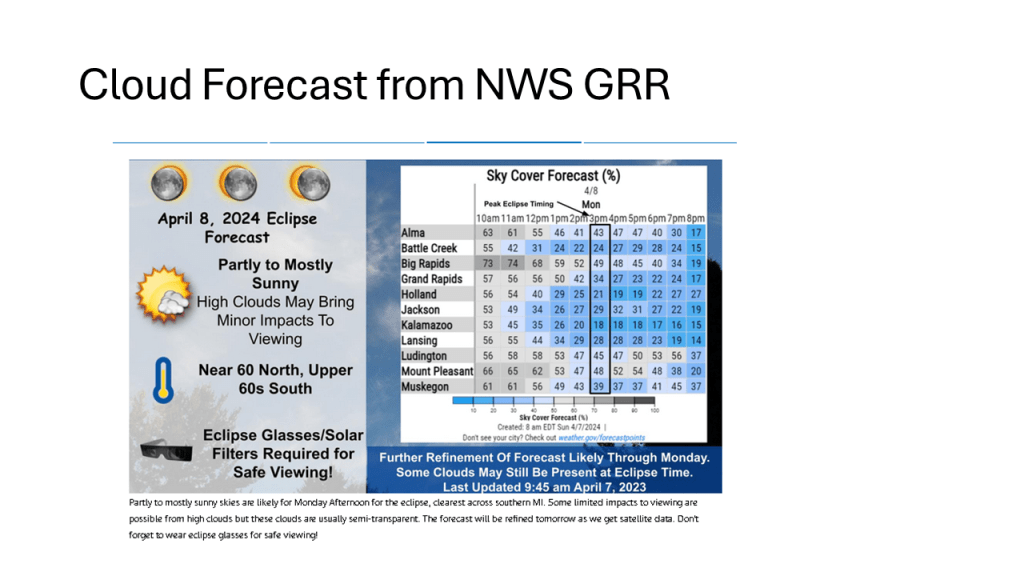
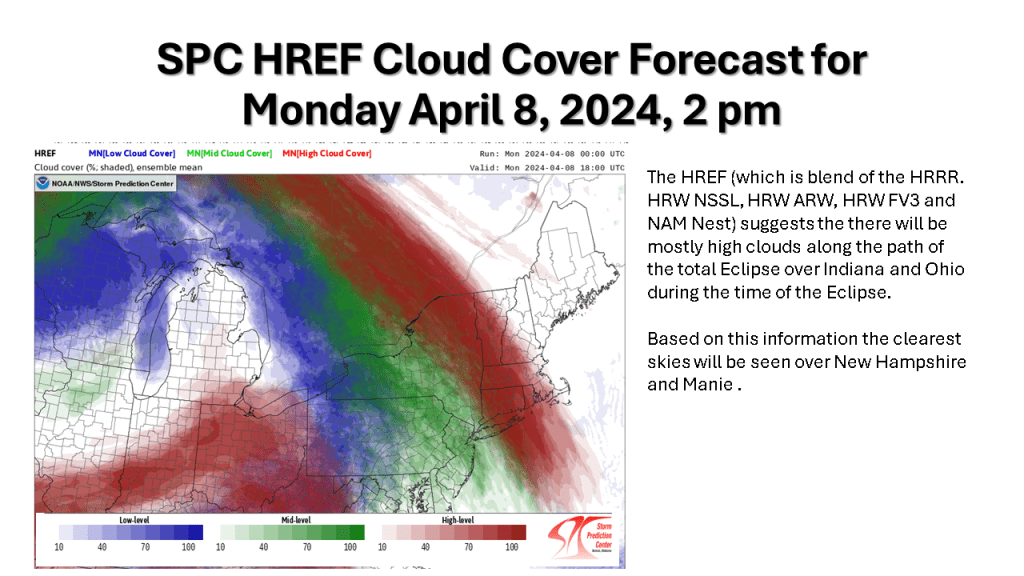
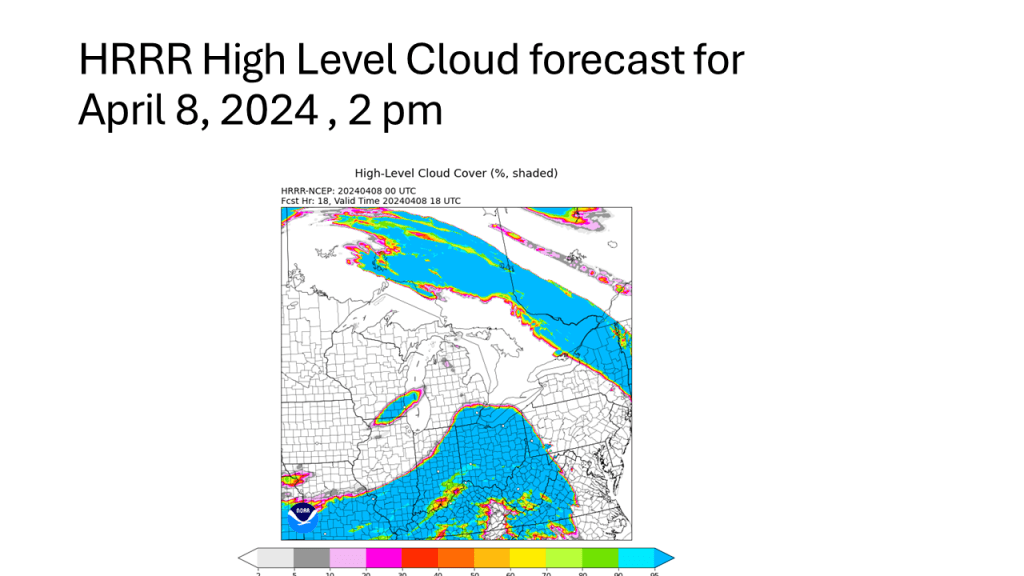
I waited for the evening HREF to come in so I could use the very latest model data for this forecast. Based on the HREF , NAM 12k m, NAM 3Km and the HRRR, it seems likely there will be high clouds over the Eclipse track from Indiana into Ohio. Being high clouds, more than likely you’d see some of the Eclipse. The best viewing still seems to be in over New Hampshire and Maine.

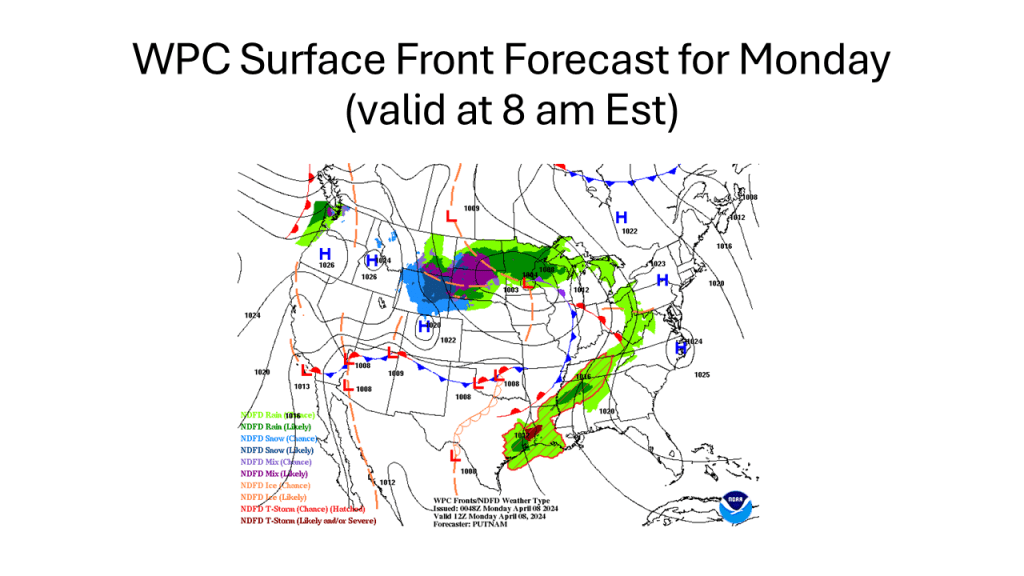

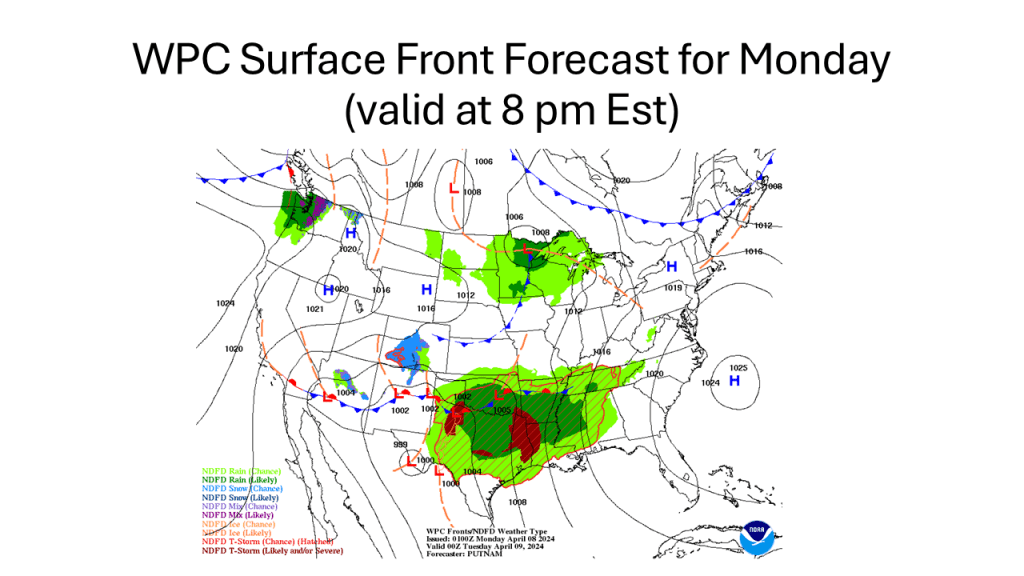


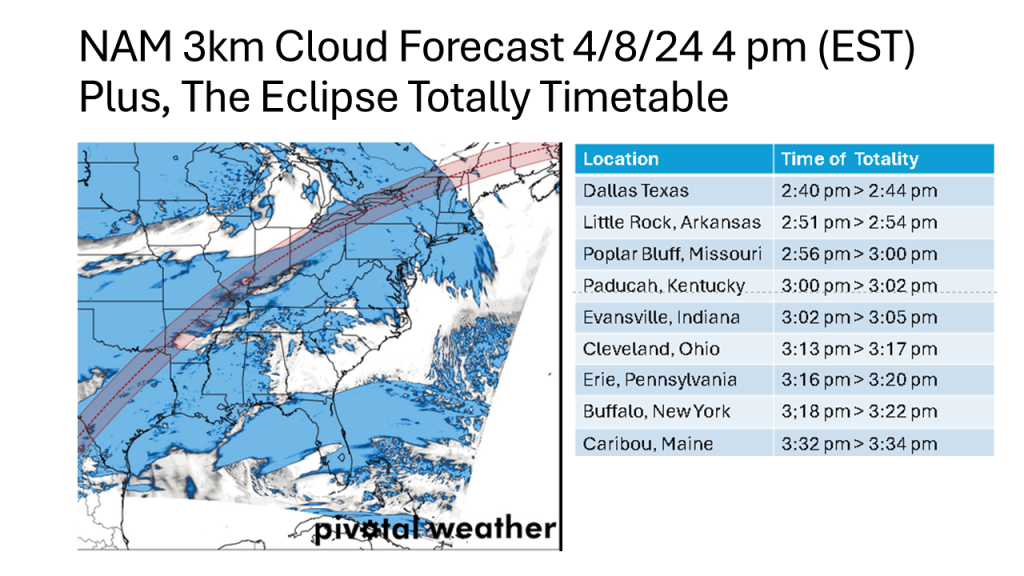
Today I used the NAM 3km forecast since that now goes out, hour by hour to 8 pm on Monday. I hope tomorrow evening to update with the HREF, which I still believe is most reliable for cloud cover forecasting.
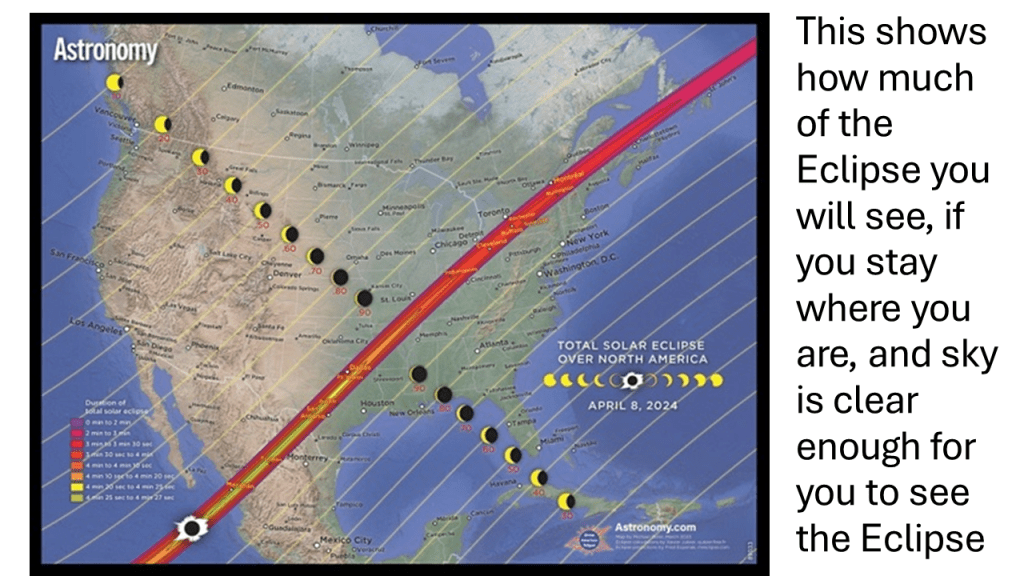
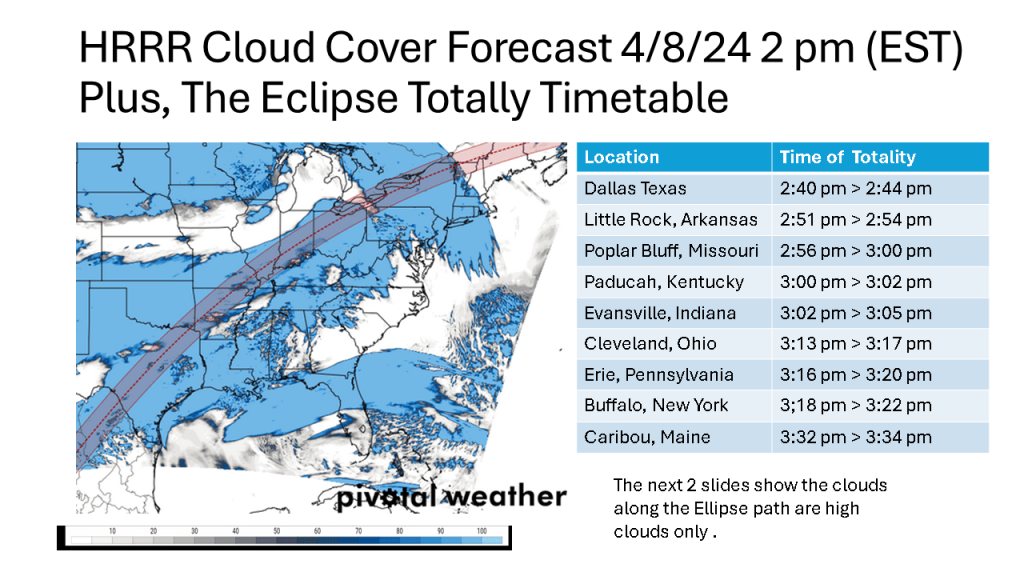
As for the best location to see the Eclipse,for those in this area, I would say anywhere along the track form Evansville Indiana to near Cleveland. Most of the models continue to favor this area .


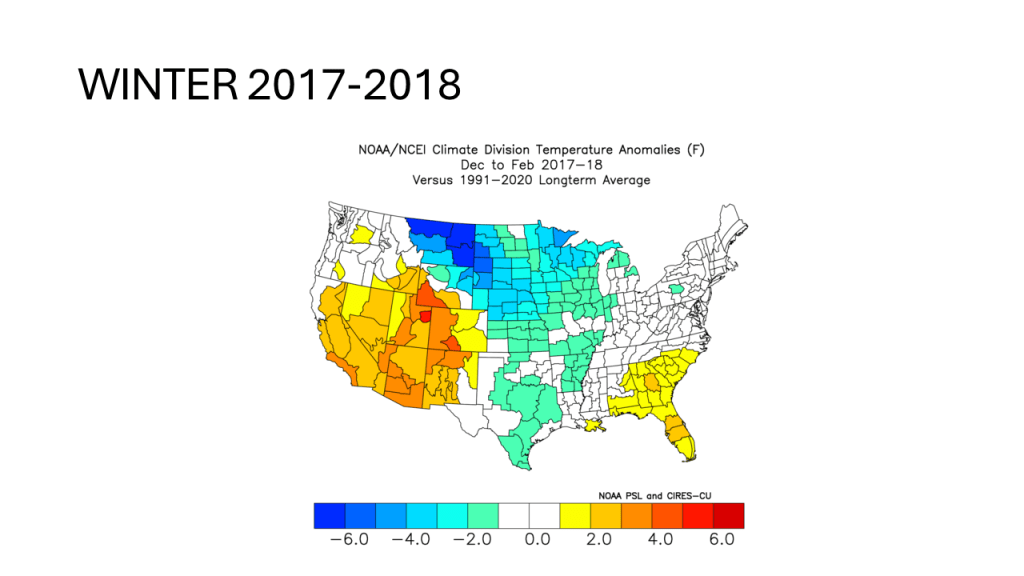
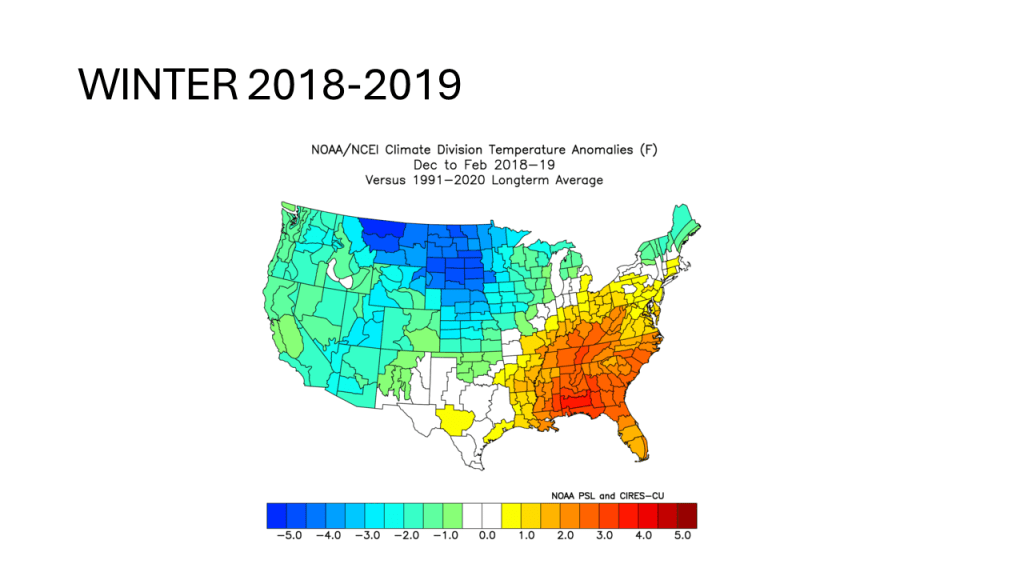
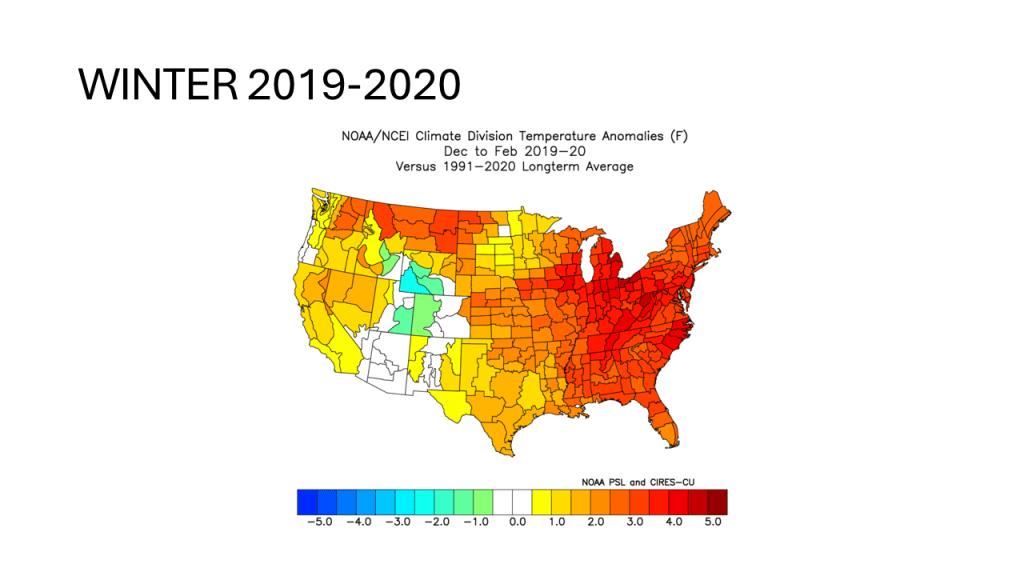
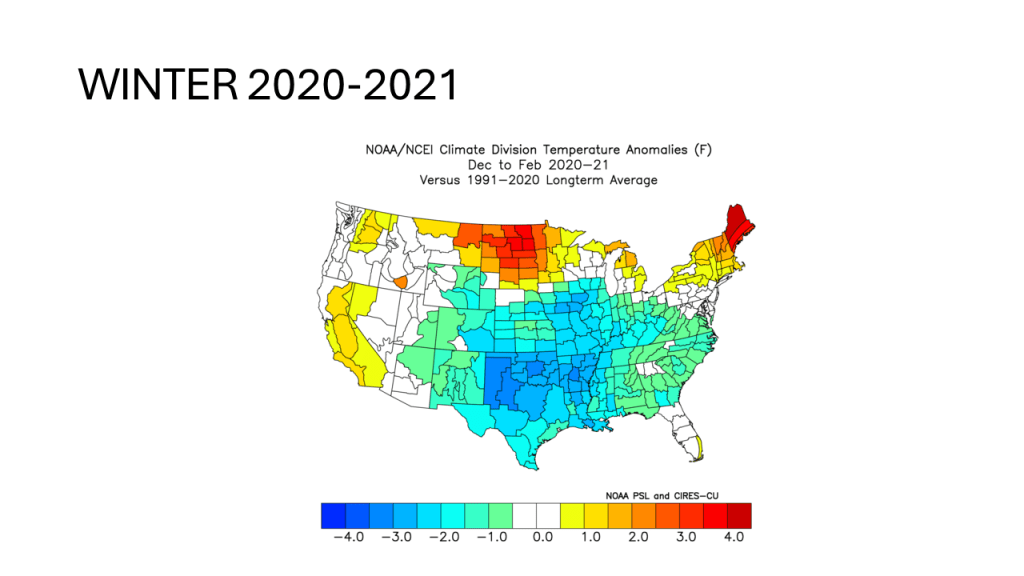
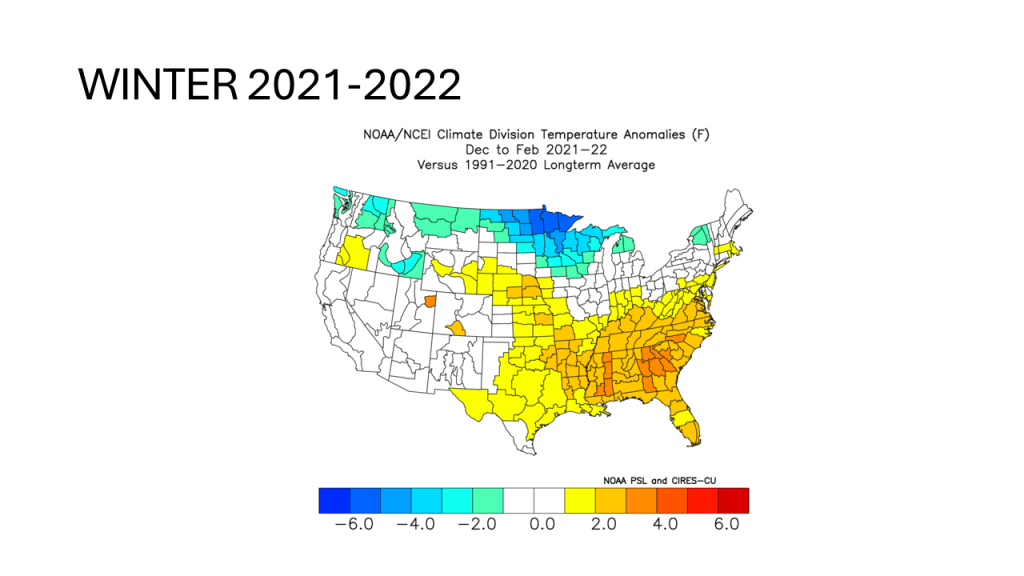
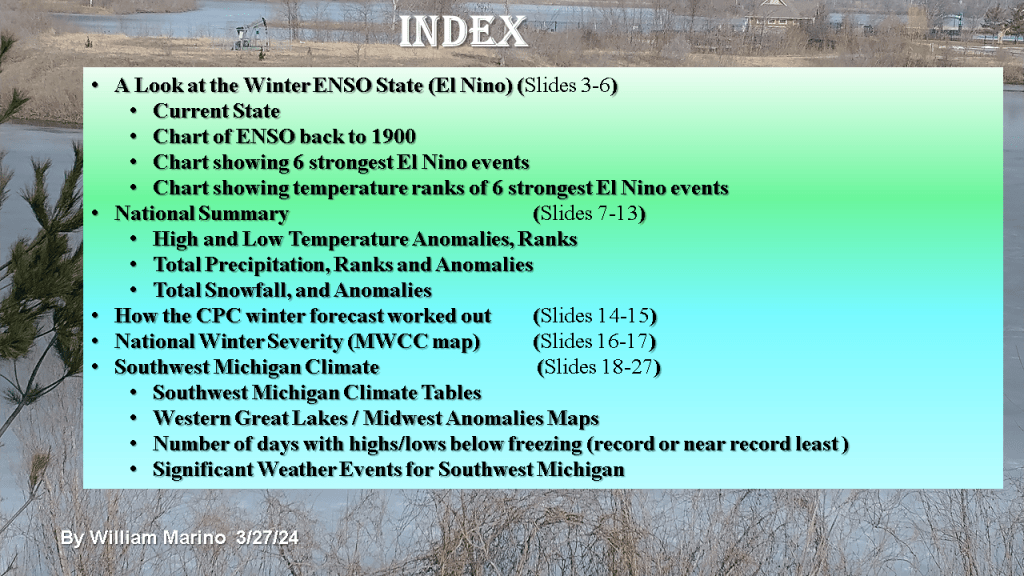
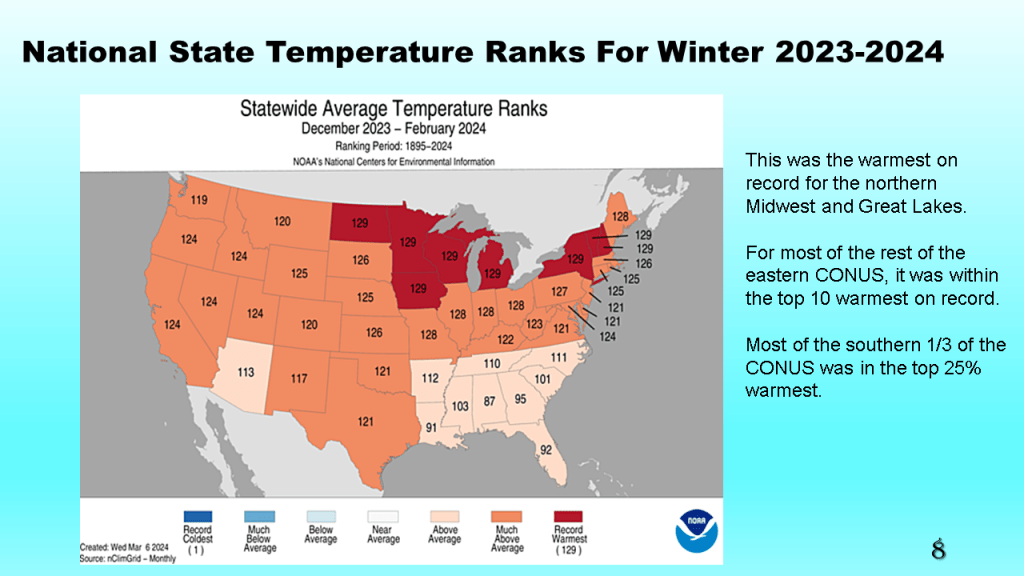
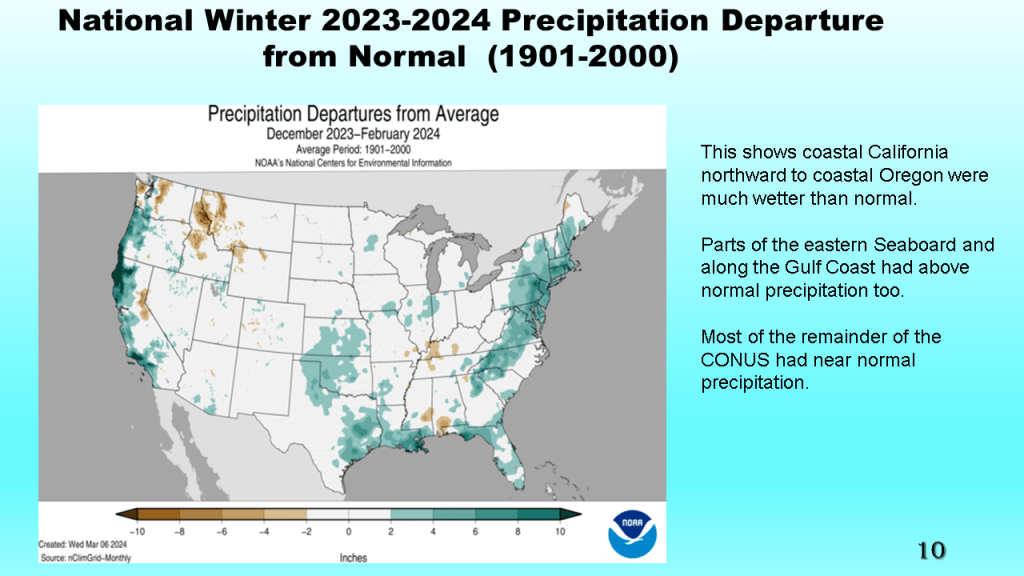
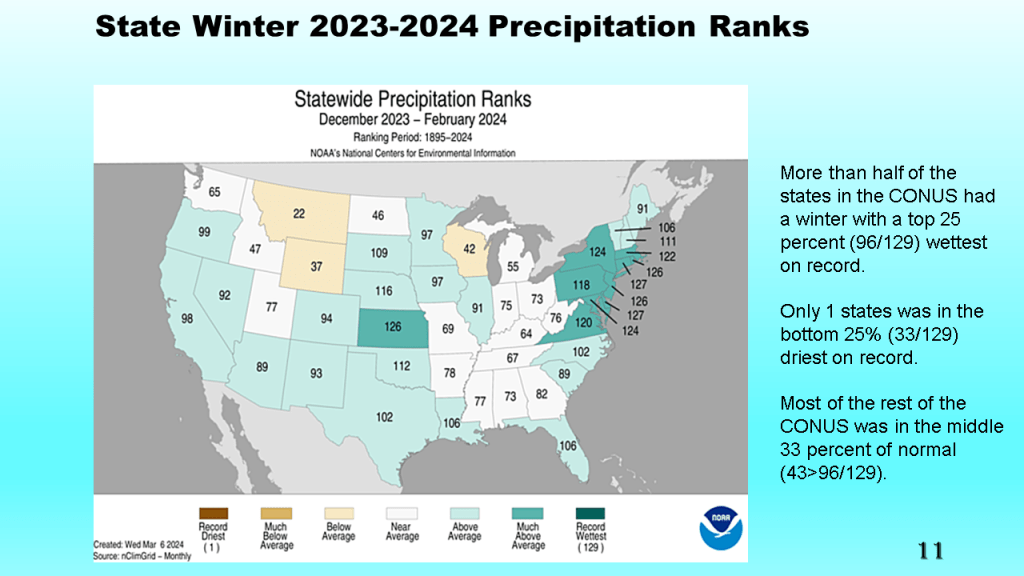
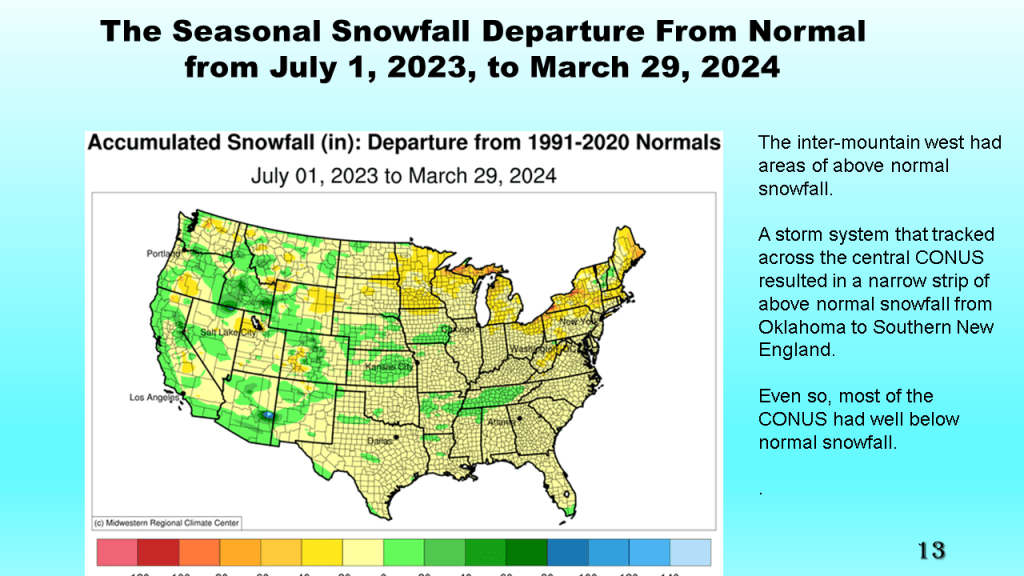
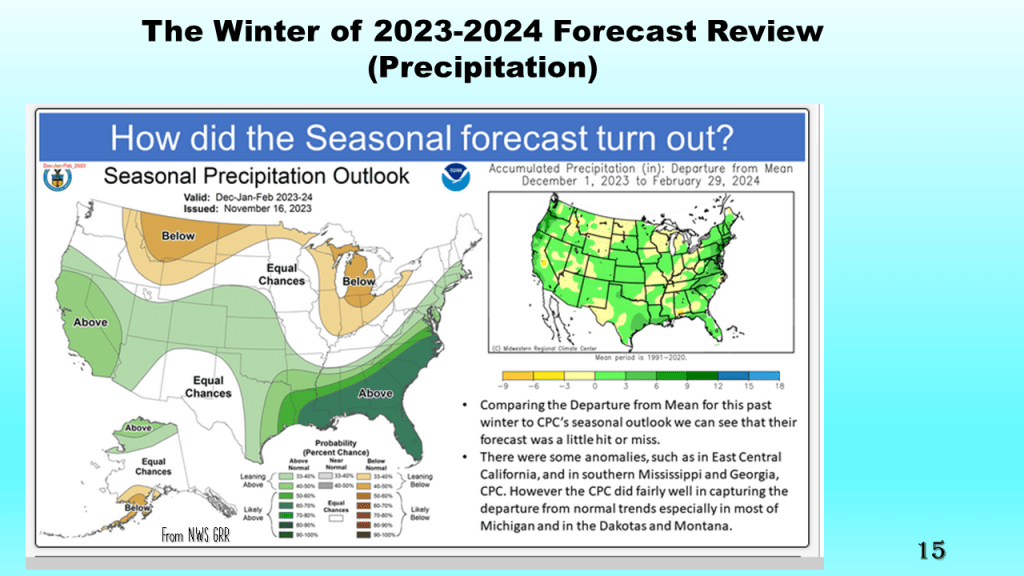
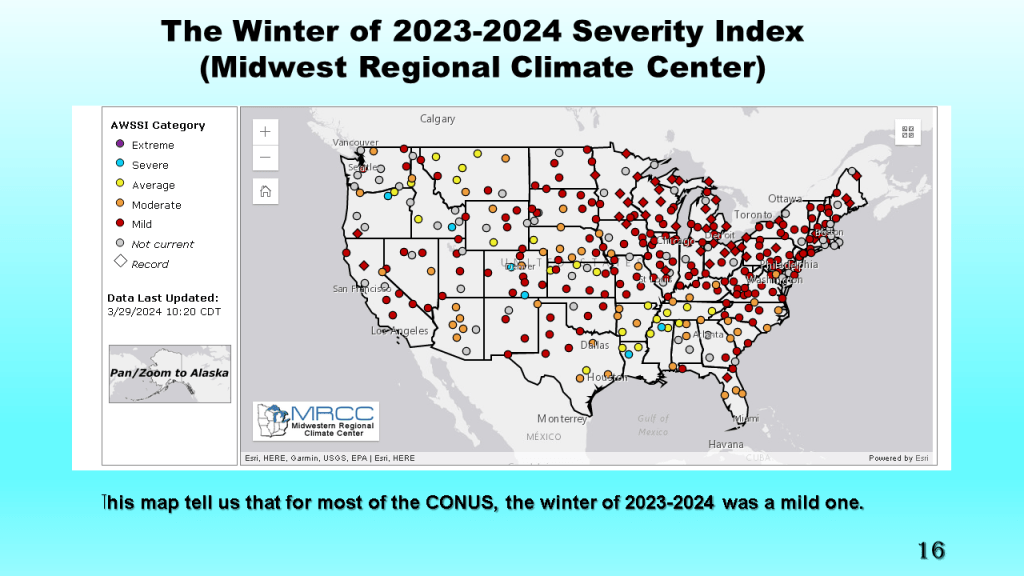
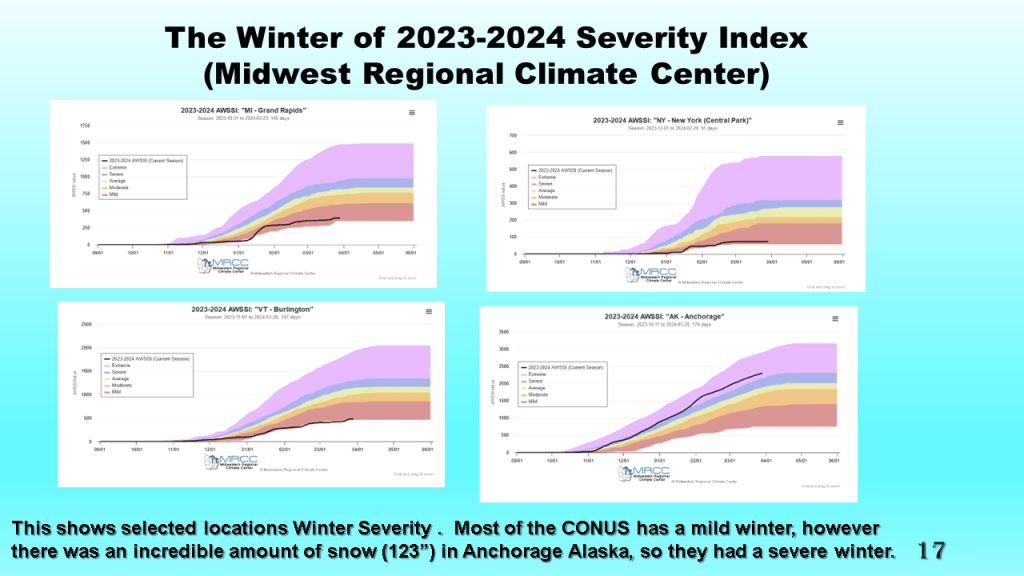
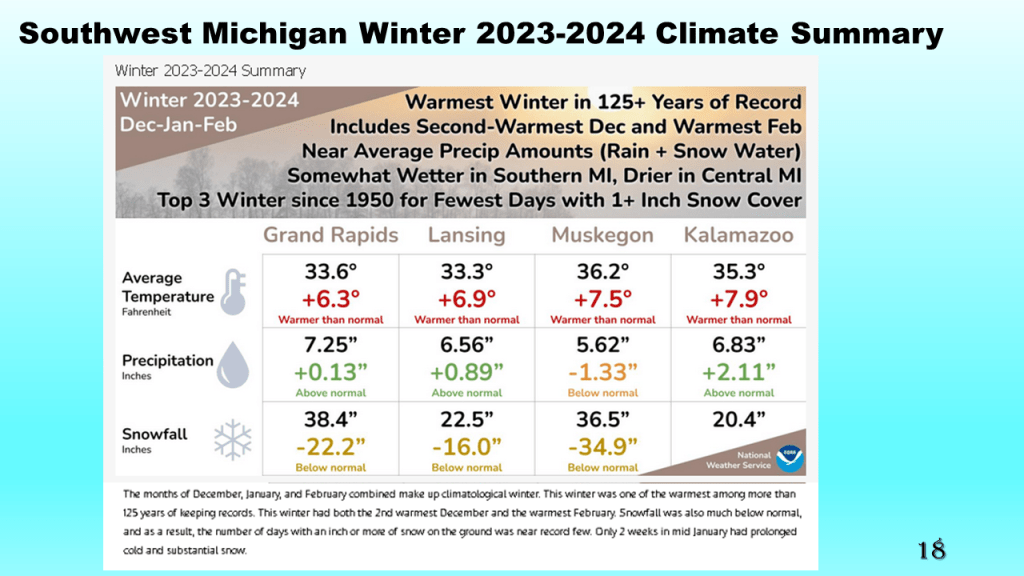
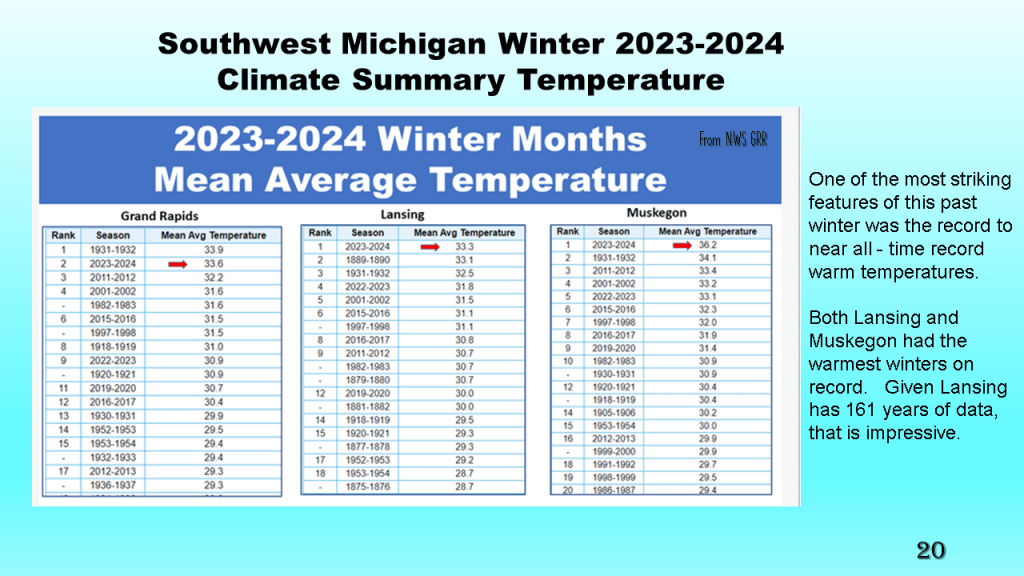
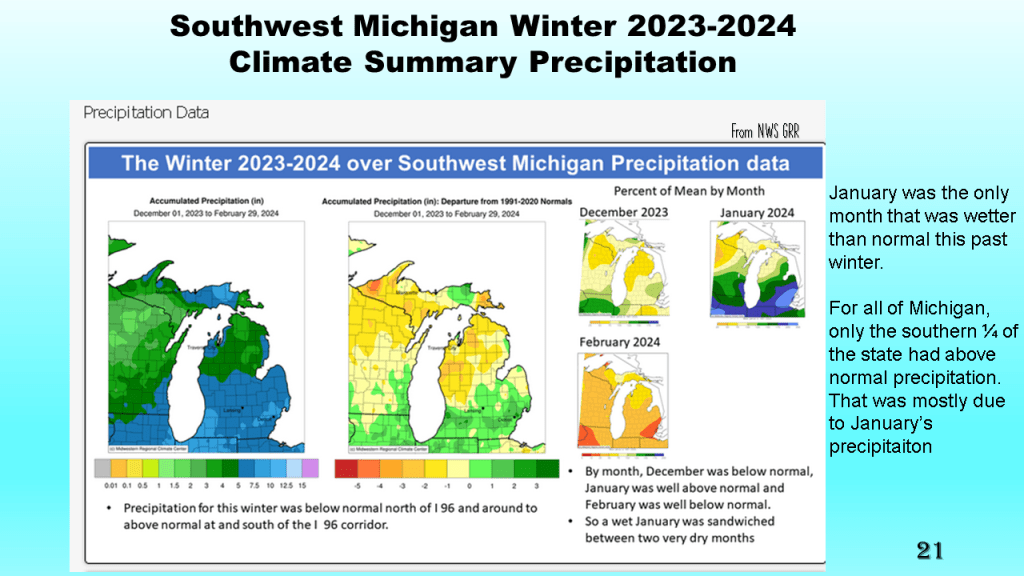
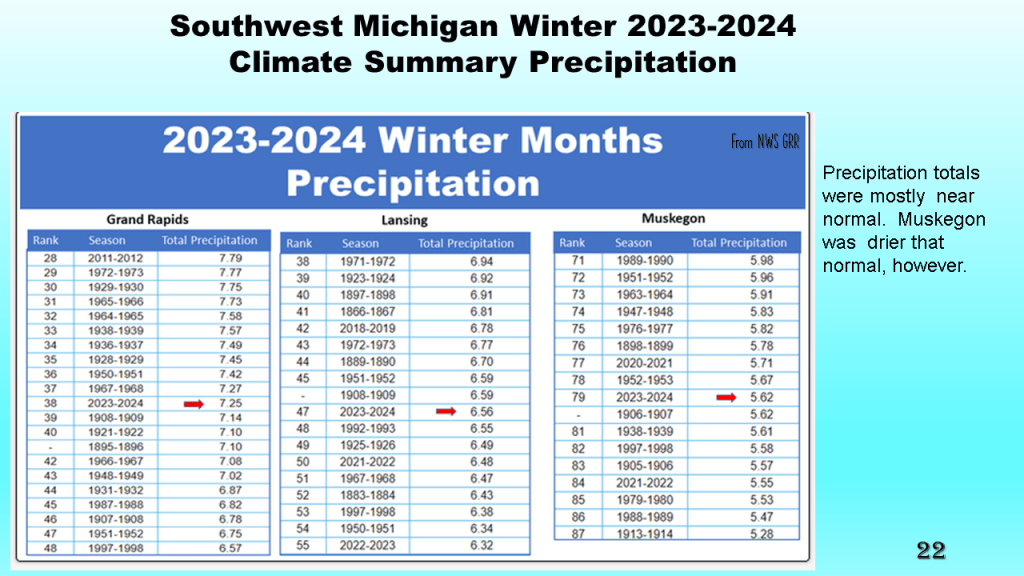
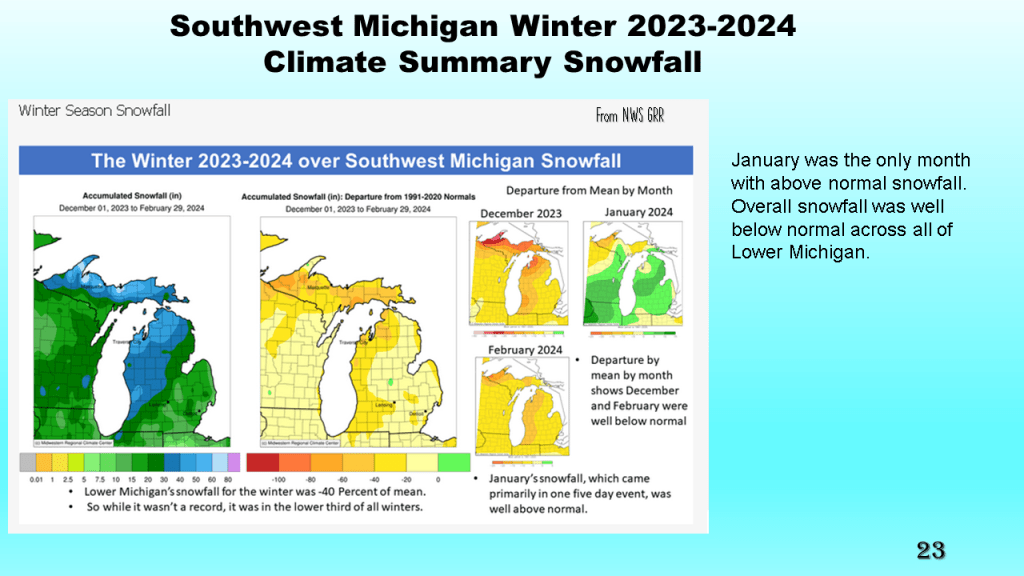
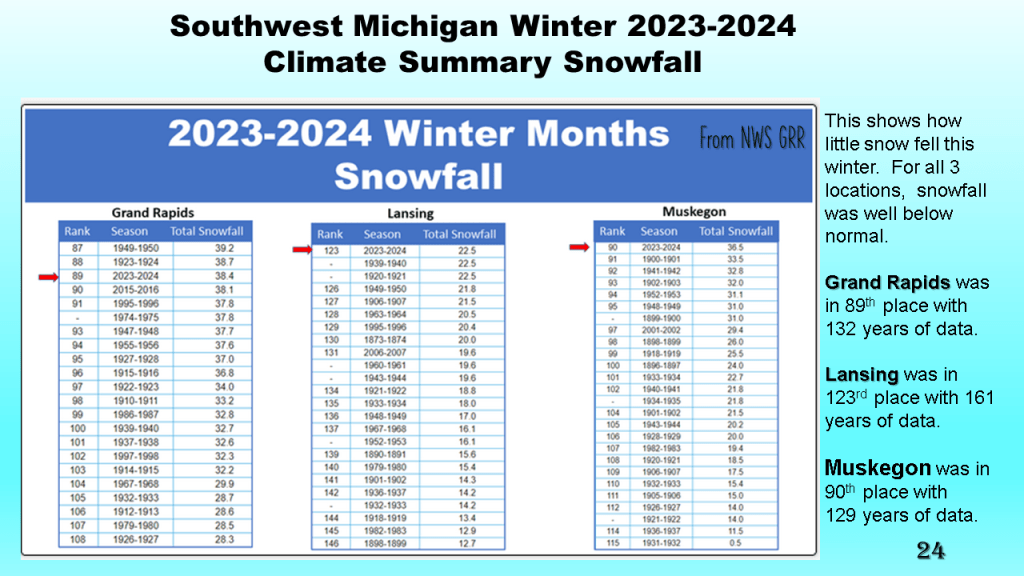
This was both nationally and locally one of the warmest winters on record, with records going back to 1895. Nationally and locally snowfall was below to well below normal. Precipitation was mostly near normal.


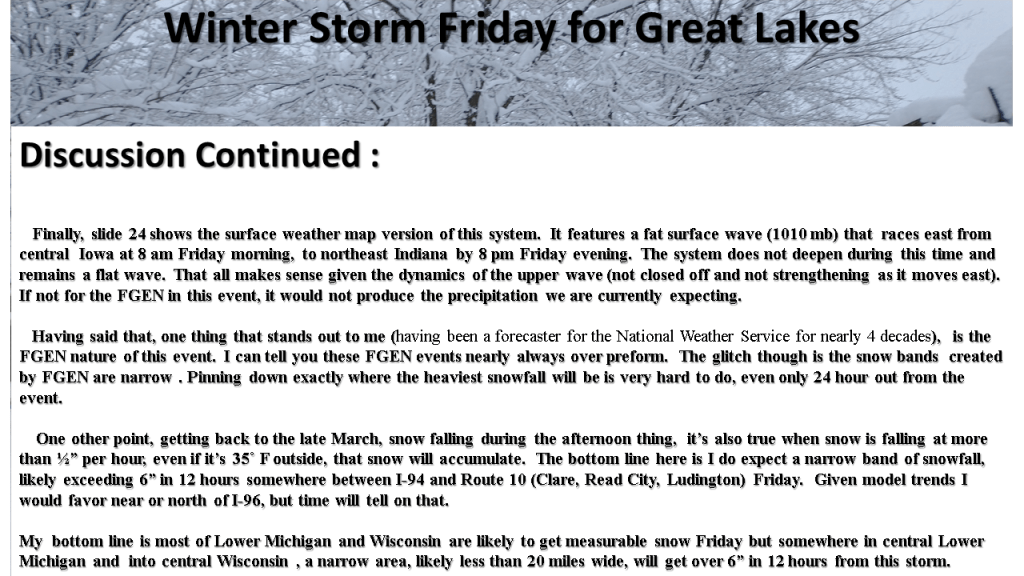
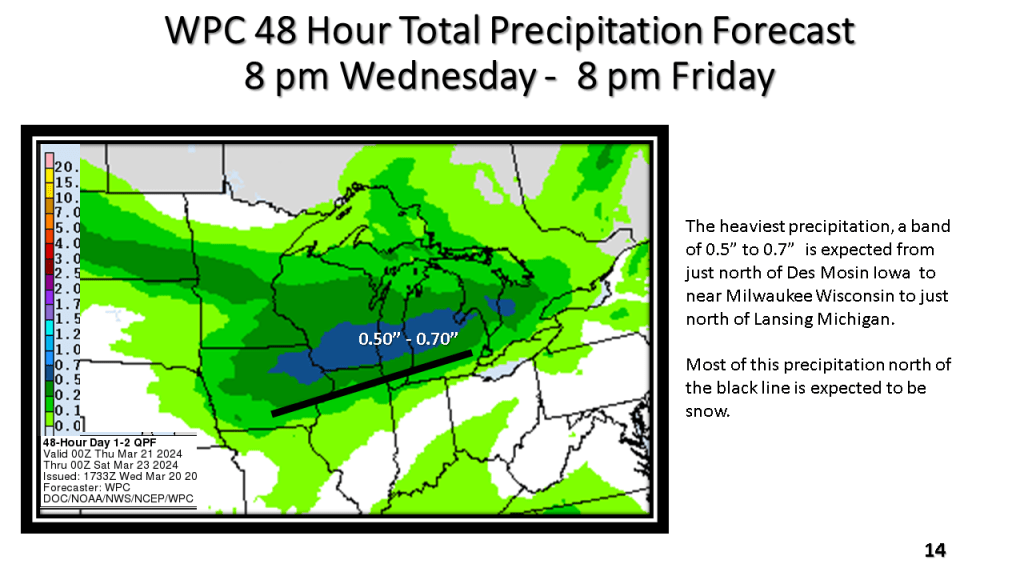
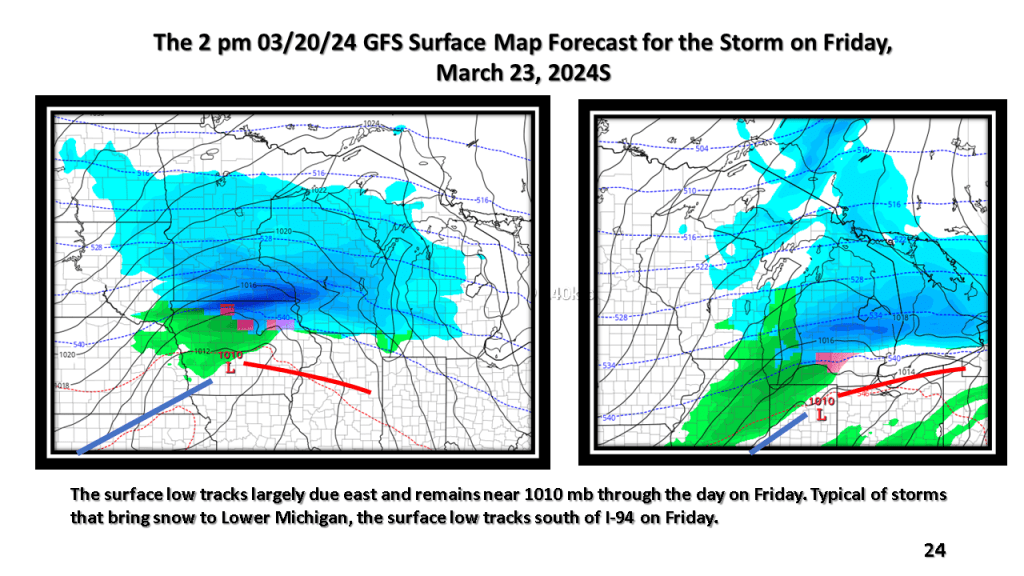
A narrow band of snowfall greater than 6″ in 12 hours is expected about 100 miles north of the track of the surface low. That would be near or just north of I-96 in Michigan. Snowfall rates in the heaviest snow area will be high enough to accumulate during the daytime, even in late March.


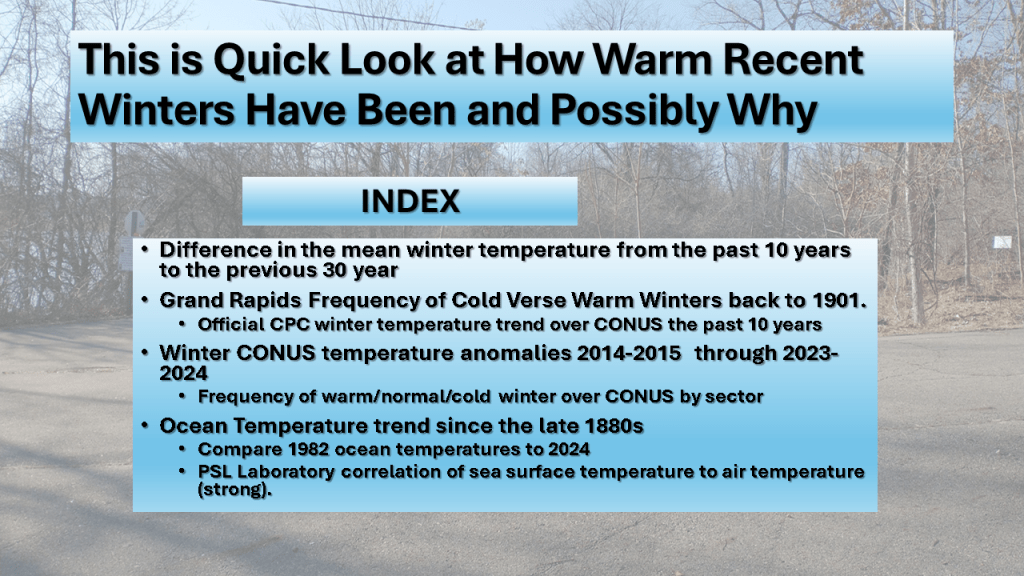
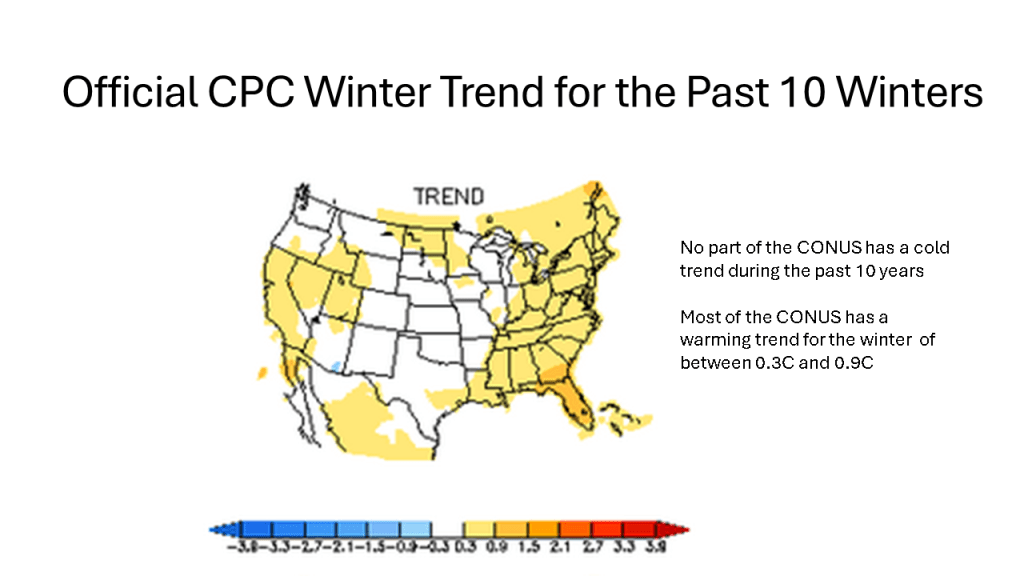
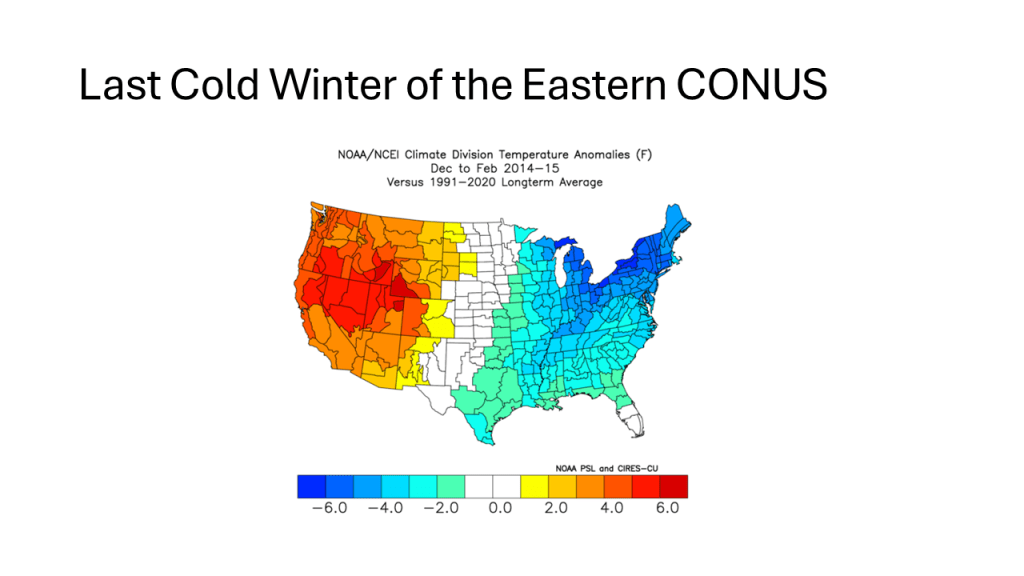
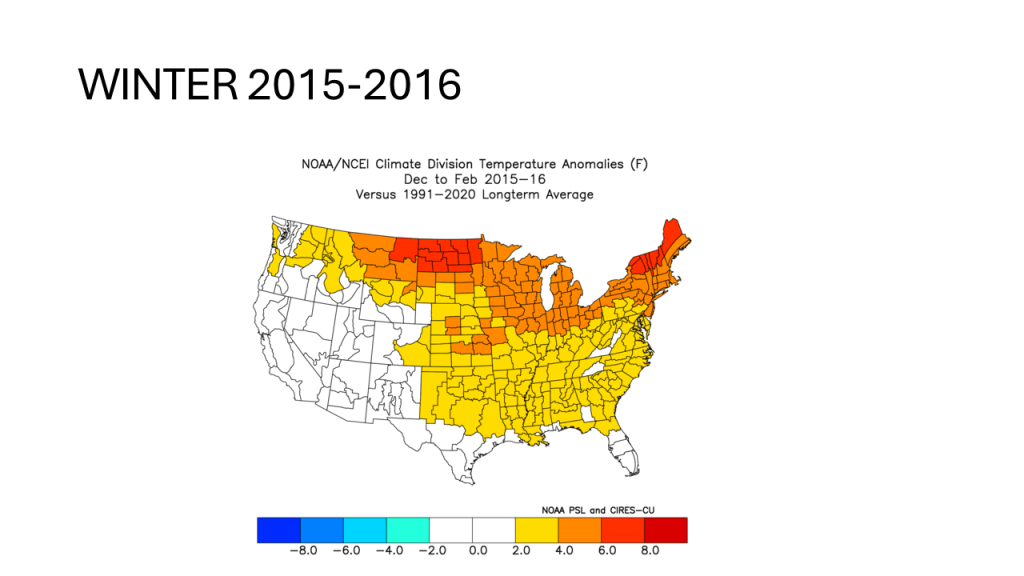
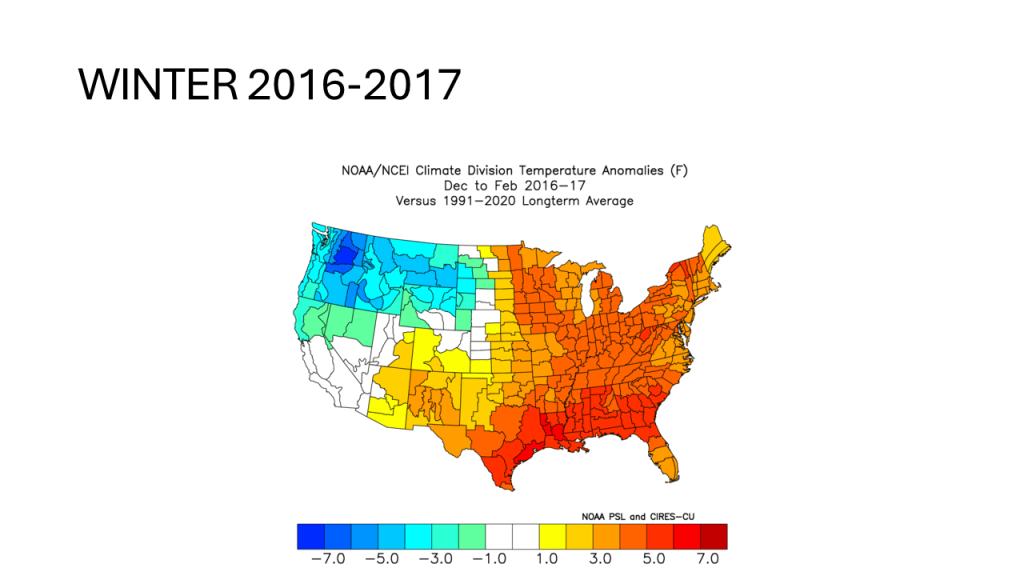
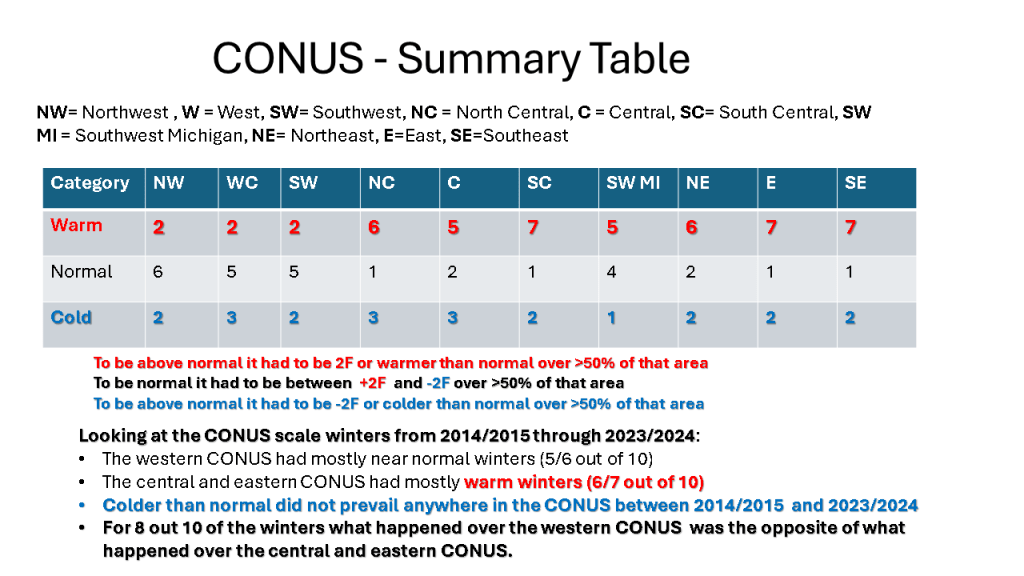
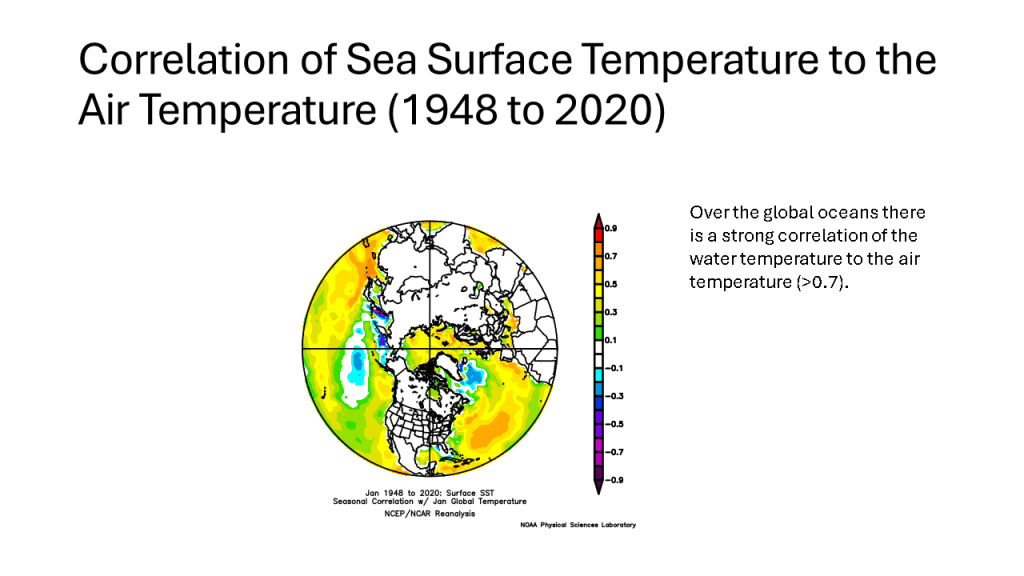
This is an update to what I did yesterday but with a lot more detail. I have added CONUS scale winter temperature anomalies for each of the past 10 years so you can see for yourself, in your area how the cold winter frequency has changed (there is a summary CONUS scale summary table for this now too). I have added correlation slides from CPC and Physical Science Laboratories to show there really the correlation I am suggesting is true.